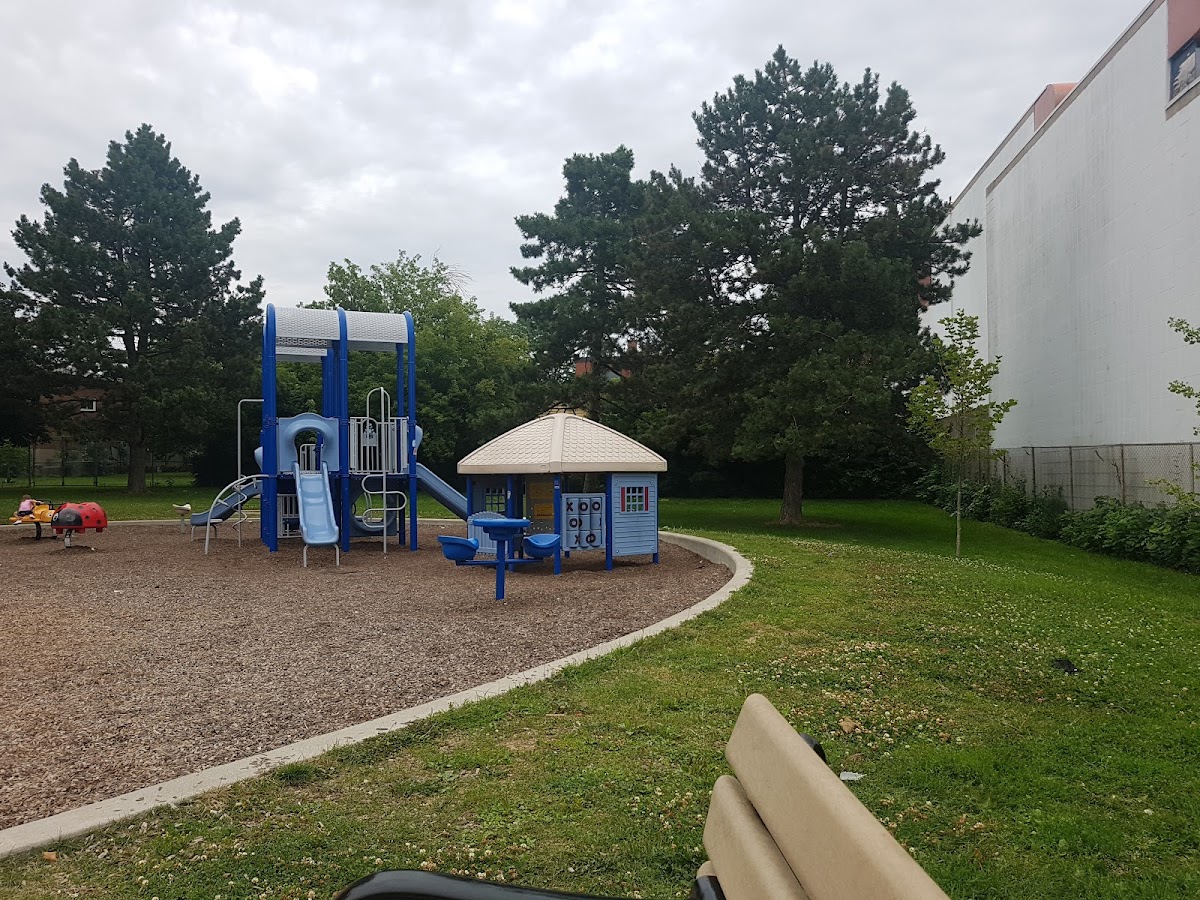
Danforth Gardens Park
Parkette, above average overall (score 42, rank ~83th percentile). Strongest: edge activation; weakest: natural comfort.
Photo by Jessica Whitmore via Google Places · cached 5/9/2026
Danforth Gardens Park scores 42.1 / 100. Strongest dimensions: edge activation and enclosure / eyes on park. Weakest: amenity diversity (11.9). Border-vacuum risk is low. This score is a transparent reading of Jane Jacobs-style vitality factors, not a definitive judgment.
Area · 0.83 ha
Weighted across six dimensions · confidence 62%
Scores are not bell-curved. Percentiles and expected scores provide context without changing the underlying model.
Loading map…
The parks map is loading.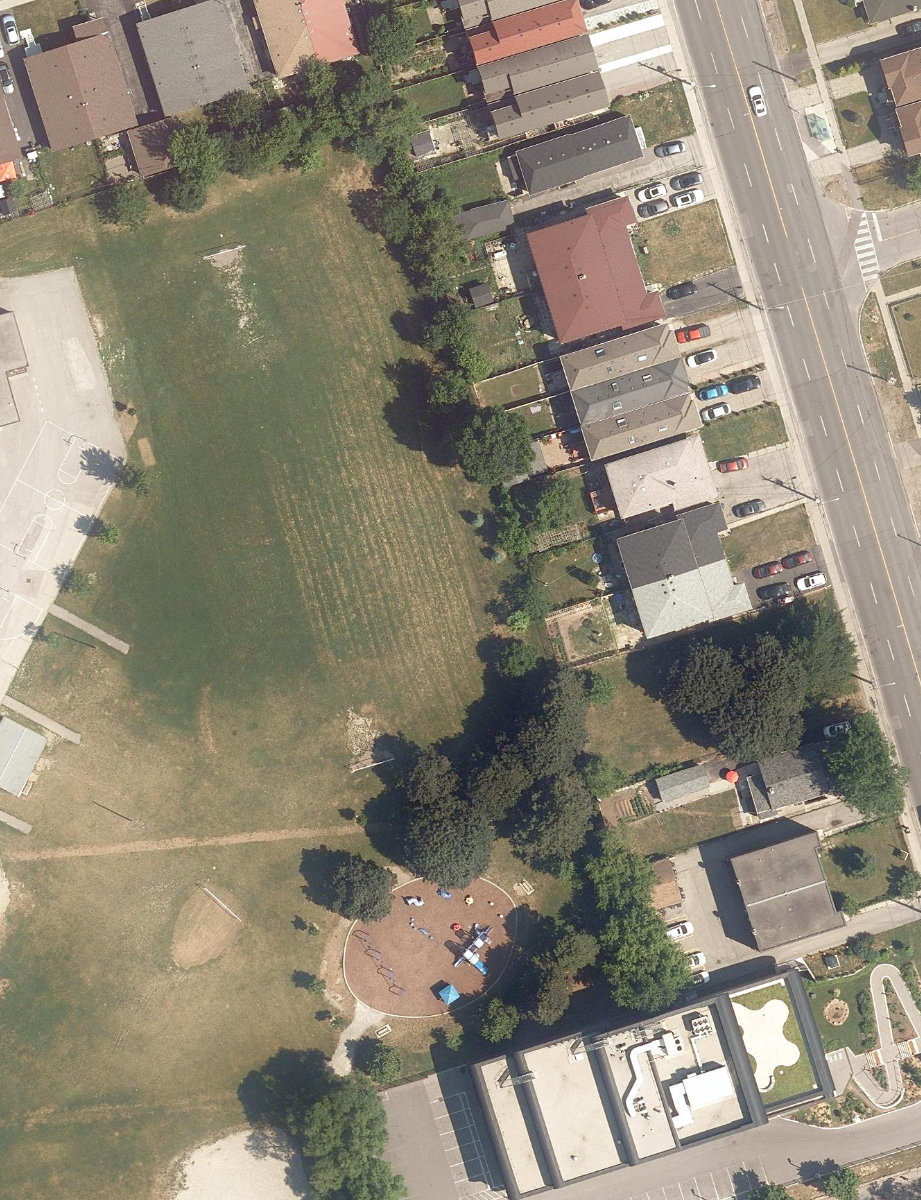
Explain this score
Where did the 42 come from? Each weighted contribution against a neutral 50 baseline. Green = pushed up; red = pulled down.
Sum of contributions = the headline score. A negative bar means that dimension dragged the park below the city-wide neutral baseline.
Why this park works
Danforth Gardens Park works because its edge activation score (67) is one of the city's strongest and its amenity diversity (12) is also top quartile (its perimeter is lined with active uses).
What limits this park
Danforth Gardens Park is held back by natural comfort (25, bottom quartile): only 0% canopy means little summer shade.
Most distinctive characteristic
Most distinctive feature: exceptionally high edge activation (67, top decile).
Jacobs reading
Danforth Gardens Park sits between an urban social park and an ecological retreat: moderately useful for both, exceptionally suited to neither.
Performance in context
- A modest overperformer for its parkette typology (+6 vs the median in small Parkette).
Typology classification
Classified as Parkette: small (8280 m²) with strong building frontage (10.7 per 100 m)
Edge Activation
Within 100 m of the park edge: 18 active uses (retail, restaurant, transit_stop, cafe) and 1 dead/hostile uses (parking_lot). Active edges keep "eyes on the park" through the day; parking lots, blank institutional walls, rail and highway frontages drain street life.
Source: OSM POIs (amenity/shop) + Toronto Building Footprints + land use
Connectivity
Connectivity blends paths, intersections, transit, entrances, and edge density. This park has 0 mapped paths/walkways and 0 sidewalk segments within 50 m; 3 street intersections within 100 m; 12 transit stops within a 400 m walk; 0 estimated access points across ~476 m of perimeter. low edge density, significant superblock penalty applied. Source coverage: centreline, transit_osm.
Source: Toronto Centreline V2 + Pedestrian Network + OSM transit stops
Amenity Diversity
1 distinct amenity types in the park (playground). Diversity, not raw count, drives the score so a park with many distinct activity types can outrank a larger park that repeats the same use.
Source: Toronto Parks & Recreation Facilities + OSM amenity tags
Natural Comfort
Natural-comfort components for this park: 0.0% estimated tree canopy; nearest waterbody ~555 m. Reading: exposed. Source coverage: waterbodies. Impervious surface is approximated (Toronto's authoritative layer ships only as a raster GeoTIFF).
Source: Toronto Treed Area + Ravine + Waterbodies + Street Tree Inventory
Enclosure / Eyes on Park
51 buildings within 25 m of the park edge (1 mid-rise, 50 low-rise, 0 tower); avg edge height 5.2 m (~2 floors); 10.7 buildings per 100 m of 476 m perimeter (strong frontage density); edges are barely there or single-storey; no towers immediately adjacent. "Eyes on the park" come strongest from the 1 mid-rise edge buildings.
Source: Toronto 3D Massing (building footprints + heights)
Border Vacuum Risk
Border-vacuum factors within 50 m of the park: parking_lot. Jacobs warned that highways, rail, parking lots and blank institutional edges act as "vacuums" that suppress foot traffic and isolate the park from its neighbourhood.
Source: Toronto Street Centreline (highways) + rail layer + OSM landuse + building footprints
Equity Context
Equity Context requires inputs not yet loaded for this park (Toronto Neighbourhood Profiles). Score is held at a neutral 50 with low confidence. Read with caution.
Source: Toronto Neighbourhood Profiles
Amenities (1 types · 1 records)
- playground
Nearby active-edge features (40)
- parking lot25 m
- retail54 m
- retail54 m
- retail55 m
- cafe: Birchmount Cafe56 m
- retail57 m
- retail57 m
- retail57 m
- transit stop: Sadler Drive60 m
- retail: Bread King Bakery60 m
- restaurant: Adi Biryani & Kabab House60 m
- retail61 m
- retail: Sam's Milk & Variety Market61 m
- restaurant: Panda Wok63 m
- transit stop: Newlands Avenue70 m
- retail: Iqbal Foods70 m
- retail: Best Value86 m
- restaurant: Pizza Pizza93 m
- retail: Dollarama97 m
- restaurant: Mama's Boys100 m
- parking lot101 m
- parking lot102 m
- restaurant: Tazij Shawarma & Pizza117 m
- retail120 m
- retail125 m
- parking lot131 m
- transit stop: Danforth Road141 m
- parking lot147 m
- restaurant: Pizza Hut153 m
- parking lot157 m
- restaurant: Subway160 m
- retail: Freedom Mobile166 m
- parking lot167 m
- parking lot167 m
- retail: Red Rose173 m
- parking lot174 m
- transit stop: Danforth Road176 m
- transit stop: Birchmount Road179 m
- restaurant: Zam Zam Tikka & Kabab House184 m
- transit stop: Zenith Drive200 m
Park profile
Five-axis radar across the structural dimensions.
Citywide percentile ranks
Across all Toronto parks in the dataset.
- Overall vitality83th
- Edge activation99th
- Connectivity9th
- Amenity diversity77th
- Natural comfort7th
- Enclosure48th
Most similar parks
Closest in metric space across the five structural dimensions.
- Hto Park WestCorridor / Linear Park37
- Cloud GardensCivic Square45
- City Wide Open SpaceCivic Square37
- Finch ParketteTower-Community Green Space41
- Toronto Waterfront ParkWaterfront Park43
Most opposite parks
Furthest in metric space. Useful for recognising what kind of park this isn’t.
- High ParkRavine / Naturalized Park47
- Rosedale Ravine LandsRavine / Naturalized Park37
- Cedarvale RavineRavine / Naturalized Park40
- Rennie ParkWaterfront Park44
- Rouge ParkWaterfront Park31
Visitor signals
Public attention measured by Google Places aggregates. This proxies attention, not occupancy. Aggregate-only: no usernames, no review text, no extra photos beyond the cached hero.
p42 citywide · p41 within Parkette
Source: Google Places API · match high (1.00 composite confidence) · last refreshed 5/9/2026. Privacy contract. Measures public attention, not occupancy.
Human activity signals: not available
No activity signals have landed for this park yet. The model has scored its physical form but it can’t yet say how often it’s programmed, photographed, or walked through. See /data-ethics for what we will and will not collect.
Does this score feel accurate?
Your read of Danforth Gardens Parkmatters. We’re testing whether the model lines up with how people actually use the park. Submissions are stored locally; no account needed.
Tell us how this park feels
We measure structure (canopy, edges, connectivity). You measure feeling. Both matter, and disagreement is itself useful civic data.
What would improve this park?
Generated from the weakest measured dimensions: a starting point, not a prescription.
- Add or open more entrances and improve sidewalk continuity around the park. More permeability means more spontaneous use.
- Diversify what people can do in the park (playground, washroom, water, shade, performance, sport, garden): even small additions raise this score.
- Increase canopy and reduce paved area. Shade and water features extend usable hours and seasons.
Data sources
- City of Toronto Open Data: Parks (Green Space)Polygon boundaries, official names, types.
- Parks & Recreation FacilitiesInventory of in-park amenities (washrooms, fields, rinks…).
- Toronto Pedestrian NetworkSidewalk segments around and through parks; estimated park entrances.
- Toronto Centreline V2Street segments + intersection nodes near park edges; trails and walkways.
- Toronto 3D MassingBuilding footprints + heights for edge-building counts, frontage density, and tower-in-the-park risk.
- Toronto Treed AreaTree canopy share inside park polygons via stratified-grid sampling.
- Toronto Waterbodies & RiversWater surface inside parks + nearest-water distance for cooling.
- Ravine & Natural Feature ProtectionRavine overlap as a cooling / natural-comfort signal.
- Toronto Street Tree InventoryTree count + density inside park polygons.
- Neighbourhood Profiles(Pending) Equity context proxy.
- OpenStreetMap (Overpass API)Cafés, restaurants, retail, transit stops, parking, highways, rail.