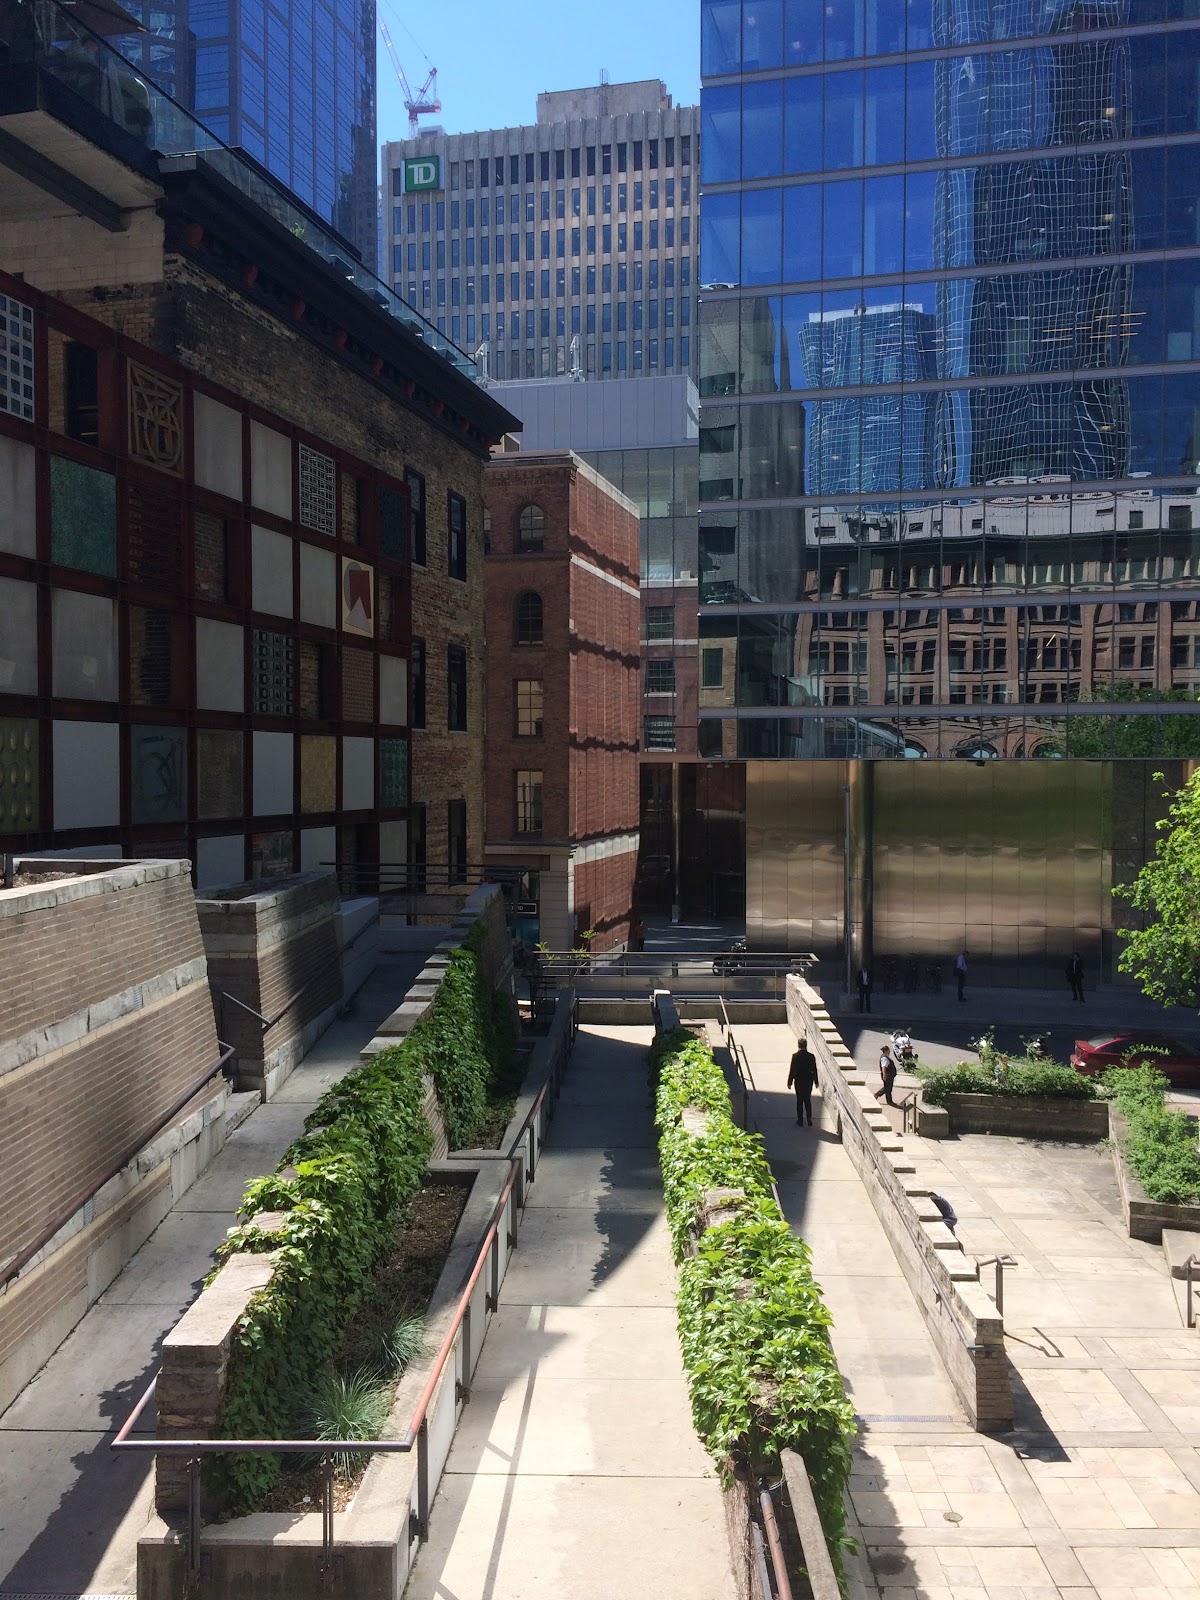
Cloud Gardens
Civic Square, in the top tier overall (score 45, rank ~88th percentile). Strongest: edge activation; weakest: natural comfort.
Photo by Donald Yap via Google Places · cached 5/9/2026
Cloud Gardens scores 44.5 / 100. Strongest dimensions: enclosure / eyes on park and edge activation. Weakest: amenity diversity (0). Border-vacuum risk is low. This score is a transparent reading of Jane Jacobs-style vitality factors, not a definitive judgment.
Area · 0.22 ha
Weighted across six dimensions · confidence 56%
Scores are not bell-curved. Percentiles and expected scores provide context without changing the underlying model.
Loading map…
The parks map is loading.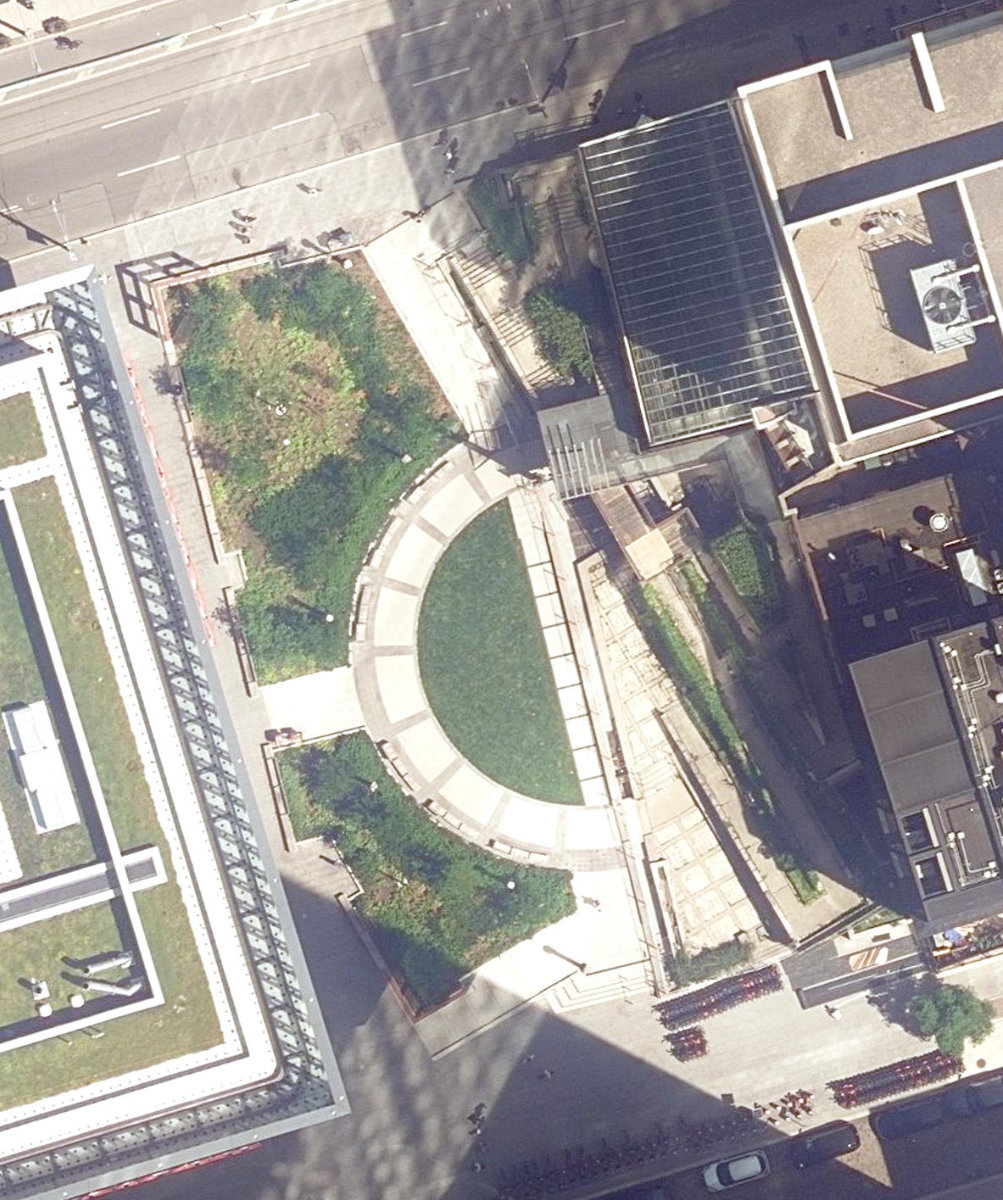
Explain this score
Where did the 45 come from? Each weighted contribution against a neutral 50 baseline. Green = pushed up; red = pulled down.
Sum of contributions = the headline score. A negative bar means that dimension dragged the park below the city-wide neutral baseline.
Why this park works
Cloud Gardens works because its edge activation score (64) is one of the city's strongest and its enclosure (69) is also above-average (its perimeter is lined with active uses).
What limits this park
Cloud Gardens is held back by natural comfort (23, bottom quartile): only 0% canopy means little summer shade.
Most distinctive characteristic
Most distinctive feature: exceptionally high edge activation (64, top decile).
Jacobs reading
Cloud Gardens sits between an urban social park and an ecological retreat: moderately useful for both, exceptionally suited to neither.
Tradeoffs
- 36 nearby towers cast wind and shadow without contributing canopy: passive surveillance is plentiful but human-scale comfort is not.
Performance in context
- A modest overperformer for its civic square typology (+8 vs the median in pocket Civic Square).
Typology classification
Classified as Civic Square: tower-walled, low canopy (0%), tight frontage: reads as a civic square
Edge Activation
Within 100 m of the park edge: 42 active uses (retail, restaurant, cafe, transit_stop) and 3 dead/hostile uses (highway). Active edges keep "eyes on the park" through the day; parking lots, blank institutional walls, rail and highway frontages drain street life.
Source: OSM POIs (amenity/shop) + Toronto Building Footprints + land use
Connectivity
Connectivity blends paths, intersections, transit, entrances, and edge density. This park has 0 mapped paths/walkways and 9 sidewalk segments within 50 m; 4 street intersections within 100 m; 54 transit stops within a 400 m walk; 0 estimated access points across ~193 m of perimeter. low edge density, significant superblock penalty applied. Source coverage: centreline, pedestrian_network, transit_osm.
Source: Toronto Centreline V2 + Pedestrian Network + OSM transit stops
Amenity Diversity
No amenities recorded. Score is 0 until inventory is loaded.
Source: Toronto Parks & Recreation Facilities + OSM amenity tags
Natural Comfort
Natural-comfort components for this park: 0.0% estimated tree canopy; nearest waterbody ~1124 m. Reading: exposed. Source coverage: waterbodies. Impervious surface is approximated (Toronto's authoritative layer ships only as a raster GeoTIFF).
Source: Toronto Treed Area + Ravine + Waterbodies + Street Tree Inventory
Enclosure / Eyes on Park
71 buildings within 25 m of the park edge (35 mid-rise, 0 low-rise, 36 tower); avg edge height 61.0 m (~20 floors); 36.8 buildings per 100 m of 193 m perimeter (strong frontage density); edges dominated by towers; 36 towers ≥ 40 m within 25 m of the edge. "Eyes on the park" come strongest from the 35 mid-rise edge buildings.
Source: Toronto 3D Massing (building footprints + heights)
Border Vacuum Risk
Park edges face the city. No significant border vacuum detected.
Source: Toronto Street Centreline (highways) + rail layer + OSM landuse + building footprints
Equity Context
Equity Context requires inputs not yet loaded for this park (Toronto Neighbourhood Profiles). Score is held at a neutral 50 with low confidence. Read with caution.
Source: Toronto Neighbourhood Profiles
Amenities (0)
No amenities recorded for this park.
Nearby active-edge features (80)
- restaurant: Sorry I’ve Got Plants0 m
- restaurant: Zen Kyoto0 m
- restaurant: Pumpernickel’s0 m
- cafe: Tim Hortons2 m
- restaurant: Richmond Station3 m
- retail8 m
- restaurant: Yulla Sushi Asian Cuisine11 m
- restaurant: Chop Hop20 m
- transit stop: Yonge Street25 m
- restaurant: Bar Filo36 m
- restaurant: Sunset Grill37 m
- restaurant: Mean Bao38 m
- restaurant: Mado40 m
- retail40 m
- cafe: Dineen Coffee41 m
- cafe: Tim Hortons41 m
- restaurant: Kinton Ramon42 m
- restaurant: Leña47 m
- restaurant: Sud Forno48 m
- restaurant: Revitasize48 m
- transit stop: Richmond Street51 m
- highway: Yonge Street53 m
- retail: Scotiabank55 m
- transit stop: Richmond Street59 m
- restaurant: Jugo Juice61 m
- restaurant: Su&Bu67 m
- cafe: Second Cup70 m
- retail72 m
- highway: Yonge Street73 m
- restaurant: Subway74 m
- highway: Yonge Street75 m
- restaurant: Mamma’s Pizza75 m
- restaurant: McDonald's79 m
- retail: Nick’s Novelty83 m
- retail: FedEx Office84 m
- retail: Flight Centre84 m
- retail: Canna North Cannabis Store85 m
- cafe: Starbucks85 m
- transit stop: Entrance from Hudson's Bay (via PATH)85 m
- transit stop: Yonge / Queen Southwest Corner85 m
- retail: Popeye's Supplements91 m
- transit stop: Yonge Street96 m
- restaurant: Katana on Bay96 m
- retail: Elapra Shoes96 m
- retail99 m
- transit stop: Queen Street East100 m
- restaurant: Hot dog stand106 m
- restaurant: Speakeasy21108 m
- restaurant: Bannock Canadian Comfort Food111 m
- transit stop: Yonge / Queen Northwest Corner111 m
- transit stop: Adelaide Street West113 m
- retail: A & E Optical113 m
- transit stop: South Entrance from Eaton Centre (via PATH)113 m
- transit stop: Entrance from One Queen Street East (via PATH)114 m
- retail: 7-Eleven115 m
- retail: Ben McNally115 m
- restaurant: Bluestone Grill & Bar115 m
- restaurant: South Street Burger116 m
- restaurant: The Gabardine116 m
- retail: Cellicon118 m
- retail: Frank & Oak120 m
- retail: Rogers120 m
- transit stop: Queen Street West120 m
- transit stop: Queen Street East121 m
- retail: GNC124 m
- retail: Oakley124 m
- retail: Urban Philosophy125 m
- restaurant: Mercatto Restaurant125 m
- restaurant: Portico127 m
- cafe: Second Cup128 m
- restaurant: Turf Lounge129 m
- restaurant: Booster Juice129 m
- transit stop: Adelaide Street West130 m
- cafe: Hale Coffee130 m
- restaurant: Subway132 m
- retail: Godiva Chocolatier132 m
- retail: Kiehl's133 m
- retail: Armani Exchange133 m
- restaurant: Duke of Richmond133 m
- restaurant: Craft Beer Market133 m
Park profile
Five-axis radar across the structural dimensions.
Citywide percentile ranks
Across all Toronto parks in the dataset.
- Overall vitality88th
- Edge activation99th
- Connectivity37th
- Amenity diversity46th
- Natural comfort2th
- Enclosure67th
Most similar parks
Closest in metric space across the five structural dimensions.
- Finch ParketteTower-Community Green Space41
- City Wide Open SpaceUrban Plaza41
- Sultan Pool Dr WalkwayParkette43
- Opera PlaceUrban Plaza48
- Wembley ParketteUrban Plaza50
Most opposite parks
Furthest in metric space. Useful for recognising what kind of park this isn’t.
- Trca Lands ( 26)Ravine / Naturalized Park27
- Rouge ParkRavine / Naturalized Park28
- Toronto Islands - Muggs Island ParkRavine / Naturalized Park25
- High ParkRavine / Naturalized Park47
- Rouge ParkWaterfront Park25
Visitor signals
Public attention measured by Google Places aggregates. This proxies attention, not occupancy. Aggregate-only: no usernames, no review text, no extra photos beyond the cached hero.
p82 citywide · p48 within Civic Square
Source: Google Places API · match high (0.84 composite confidence) · last refreshed 5/9/2026. Privacy contract. Measures public attention, not occupancy.
Human activity signals: not available
No activity signals have landed for this park yet. The model has scored its physical form but it can’t yet say how often it’s programmed, photographed, or walked through. See /data-ethics for what we will and will not collect.
Does this score feel accurate?
Your read of Cloud Gardensmatters. We’re testing whether the model lines up with how people actually use the park. Submissions are stored locally; no account needed.
Tell us how this park feels
We measure structure (canopy, edges, connectivity). You measure feeling. Both matter, and disagreement is itself useful civic data.
What would improve this park?
Generated from the weakest measured dimensions: a starting point, not a prescription.
- Add or open more entrances and improve sidewalk continuity around the park. More permeability means more spontaneous use.
- Diversify what people can do in the park (playground, washroom, water, shade, performance, sport, garden): even small additions raise this score.
- Increase canopy and reduce paved area. Shade and water features extend usable hours and seasons.
Data sources
- City of Toronto Open Data: Parks (Green Space)Polygon boundaries, official names, types.
- Parks & Recreation FacilitiesInventory of in-park amenities (washrooms, fields, rinks…).
- Toronto Pedestrian NetworkSidewalk segments around and through parks; estimated park entrances.
- Toronto Centreline V2Street segments + intersection nodes near park edges; trails and walkways.
- Toronto 3D MassingBuilding footprints + heights for edge-building counts, frontage density, and tower-in-the-park risk.
- Toronto Treed AreaTree canopy share inside park polygons via stratified-grid sampling.
- Toronto Waterbodies & RiversWater surface inside parks + nearest-water distance for cooling.
- Ravine & Natural Feature ProtectionRavine overlap as a cooling / natural-comfort signal.
- Toronto Street Tree InventoryTree count + density inside park polygons.
- Neighbourhood Profiles(Pending) Equity context proxy.
- OpenStreetMap (Overpass API)Cafés, restaurants, retail, transit stops, parking, highways, rail.