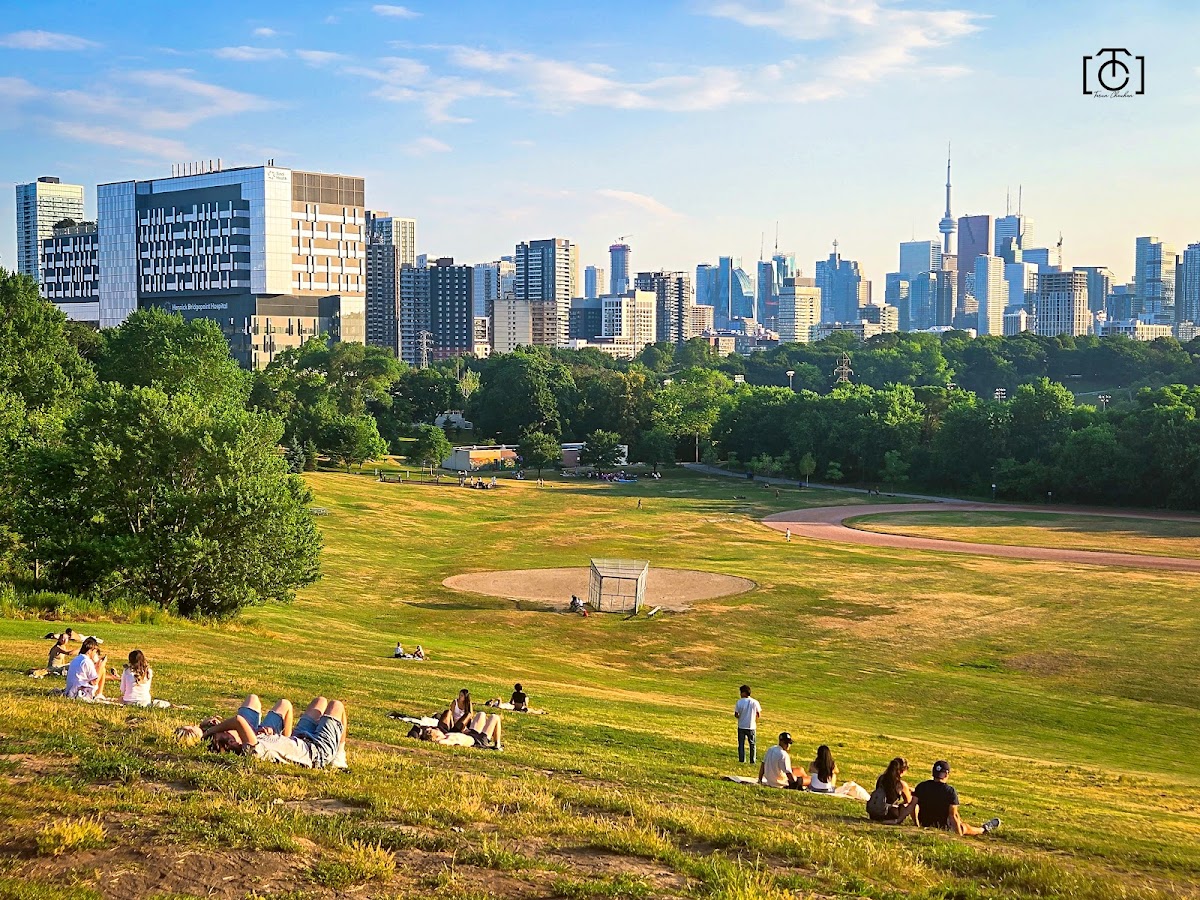
Riverdale Park East
Ravine / Naturalized Park, one of the city's strongest overall (score 63, rank ~100th percentile). Strongest: amenity diversity; weakest: natural comfort.
Photo by Tarun Chauhan via Google Places · cached 5/9/2026
Riverdale Park East scores 62.5 / 100. Strongest dimensions: enclosure / eyes on park and connectivity. Weakest: edge activation (39.4). Border-vacuum risk is low. This score is a transparent reading of Jane Jacobs-style vitality factors, not a definitive judgment.
Area · 17.91 ha
Weighted across six dimensions · confidence 72%
Scores are not bell-curved. Percentiles and expected scores provide context without changing the underlying model.
Loading map…
The parks map is loading.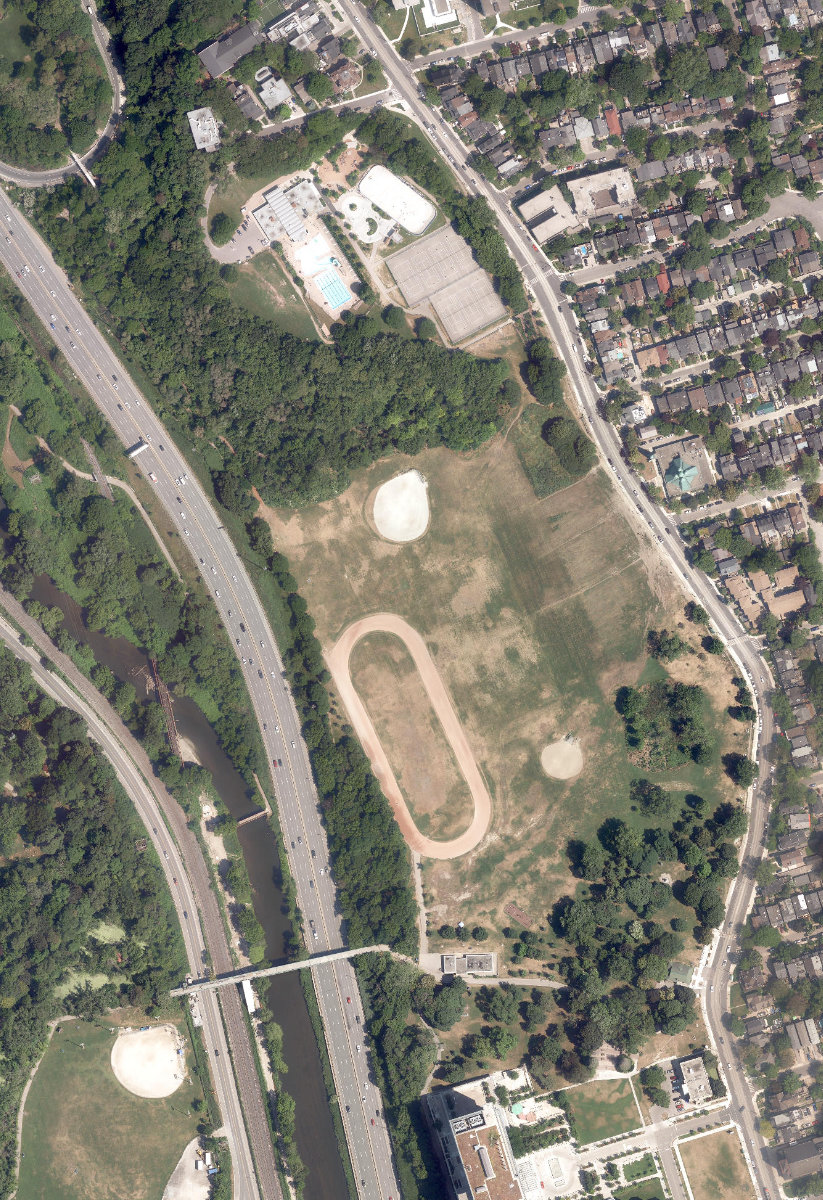
Explain this score
Where did the 63 come from? Each weighted contribution against a neutral 50 baseline. Green = pushed up; red = pulled down.
Sum of contributions = the headline score. A negative bar means that dimension dragged the park below the city-wide neutral baseline.
Why this park works
Riverdale Park East works because its amenity diversity score (51) is one of the city's strongest and its connectivity (79) is also top decile (8 distinct amenity types support different kinds of use).
What limits this park
.
Most distinctive characteristic
Most distinctive feature: exceptionally high amenity diversity (51, top decile).
Jacobs reading
Riverdale Park East sits between an urban social park and an ecological retreat: moderately useful for both, exceptionally suited to neither.
Performance in context
- This park is a strong overperformer for its cohort: raw 63 versus an expected 36 for similar parks (large Ravine / Naturalized Park ravine) (gap +27).
Typology classification
Classified as Ravine / Naturalized Park: 96% ravine overlap, 23% canopy. Secondary read: Neighbourhood Park (17.9 ha, framed by 36 mid-rise vs 4 towers).
Edge Activation
Within 100 m of the park edge: 15 active uses (transit_stop, cafe) and 4 dead/hostile uses (parking_lot, highway). Active edges keep "eyes on the park" through the day; parking lots, blank institutional walls, rail and highway frontages drain street life.
Source: OSM POIs (amenity/shop) + Toronto Building Footprints + land use
Connectivity
Connectivity blends paths, intersections, transit, entrances, and edge density. This park has 27 mapped paths/walkways and 45 sidewalk segments within 50 m; 22 street intersections within 100 m; 37 transit stops within a 400 m walk; 12 estimated access points across ~1,949 m of perimeter. edge density is healthy, no superblock penalty. Source coverage: centreline, pedestrian_network, transit_osm.
Source: Toronto Centreline V2 + Pedestrian Network + OSM transit stops
Amenity Diversity
8 distinct amenity types in the park (dog_area, fitness, picnic, playground, sports_field, tennis, …). Diversity, not raw count, drives the score so a park with many distinct activity types can outrank a larger park that repeats the same use.
Source: Toronto Parks & Recreation Facilities + OSM amenity tags
Natural Comfort
Natural-comfort components for this park: 23.2% estimated tree canopy; 96.2% inside the ravine system; nearest waterbody ~163 m; 33 city-mapped trees inside the polygon (1.8/ha). Reading: ravine-cooled. Source coverage: treed_area, ravine, waterbodies, street_trees. Impervious surface is approximated (Toronto's authoritative layer ships only as a raster GeoTIFF).
Source: Toronto Treed Area + Ravine + Waterbodies + Street Tree Inventory
Enclosure / Eyes on Park
146 buildings within 25 m of the park edge (36 mid-rise, 106 low-rise, 4 tower); avg edge height 9.9 m (~3 floors); 7.5 buildings per 100 m of 1,949 m perimeter (strong frontage density); edges are at a Jacobs-scale walkable mid-rise (3 to 7 floors); 4 towers ≥ 40 m within 25 m of the edge. "Eyes on the park" come strongest from the 36 mid-rise edge buildings.
Source: Toronto 3D Massing (building footprints + heights)
Border Vacuum Risk
Border-vacuum factors within 50 m of the park: parking_lot, parking_lot. Jacobs warned that highways, rail, parking lots and blank institutional edges act as "vacuums" that suppress foot traffic and isolate the park from its neighbourhood.
Source: Toronto Street Centreline (highways) + rail layer + OSM landuse + building footprints
Equity Context
Equity Context requires inputs not yet loaded for this park (Toronto Neighbourhood Profiles). Score is held at a neutral 50 with low confidence. Read with caution.
Source: Toronto Neighbourhood Profiles
Amenities (8 types · 9 records)
- dog area
- fitness
- picnic
- playground
- sports field
- tennis
- track
- washroom
Nearby active-edge features (39)
- transit stop: Withrow Avenue0 m
- parking lot0 m
- transit stop: Millbrook Crescent1 m
- transit stop: Langley Avenue2 m
- transit stop: Langley Avenue8 m
- transit stop: Withrow Avenue9 m
- transit stop: Millbrook Crescent10 m
- transit stop: Langley Avenue, Bridgepoint Health Centre11 m
- transit stop: Withrow Avenue12 m
- transit stop: Millbrook Crescent14 m
- transit stop: Withrow Avenue17 m
- transit stop: Langley Avenue, Bridgepoint Health Centre17 m
- parking lot19 m
- transit stop: Millbrook Crescent22 m
- cafe: Rooster Coffee House24 m
- parking lot51 m
- highway: Don Valley Parkway75 m
- transit stop: Jack Layton Way, Bridgepoint Health76 m
- transit stop: Jack Layton Way, Bridgepoint Health77 m
- highway: Don Valley Parkway102 m
- rail: GO Transit - Bala Subdivision112 m
- parking lot120 m
- parking lot122 m
- transit stop: Wolfrey Avenue128 m
- transit stop: Wolfrey Avenue129 m
- transit stop: St. Matthews Road133 m
- parking lot134 m
- transit stop: Wolfrey Avenue149 m
- retail: Mary's Variety & Grocery Store150 m
- transit stop: Wolfrey Avenue151 m
- school: Quest Alternative Senior School151 m
- transit stop: Gerrard Street East162 m
- parking lot162 m
- transit stop: Gerrard Street East163 m
- transit stop: Broadview Avenue171 m
- rail: GO Transit - Bala Subdivision176 m
- retail: Adam and Davis193 m
- parking lot198 m
- retail: Morningstar East198 m
Park profile
Five-axis radar across the structural dimensions.
Citywide percentile ranks
Across all Toronto parks in the dataset.
- Overall vitality100th
- Edge activation91th
- Connectivity98th
- Amenity diversity100th
- Natural comfort85th
- Enclosure88th
Most similar parks
Closest in metric space across the five structural dimensions.
- Trinity Bellwoods ParkNeighbourhood Park63
- Hillcrest ParkNeighbourhood Park66
- Vermont Square ParkCivic Square61
- Norwood ParkNeighbourhood Park59
- Moorevale ParkAthletic / Recreation Park57
Most opposite parks
Furthest in metric space. Useful for recognising what kind of park this isn’t.
- Rouge ParkRavine / Naturalized Park18
- Trca Lands ( 58)Waterfront Park18
- Rouge ParkRavine / Naturalized Park21
- Toronto Islands - Muggs Island ParkRavine / Naturalized Park25
- Rouge ParkRavine / Naturalized Park19
Visitor signals
Public attention measured by Google Places aggregates. This proxies attention, not occupancy. Aggregate-only: no usernames, no review text, no extra photos beyond the cached hero.
“A popular tobogganing spot, this sizable park with skyline views offers an ice rink & sports fields.” (Google editorial summary)
p98 citywide · p98 within Ravine / Naturalized Park
Source: Google Places API · match unverified (0.00 composite confidence) · last refreshed 5/9/2026. Privacy contract. Measures public attention, not occupancy.
Human activity signals
Programming, social attention, temporal rhythm, and nearby pedestrian / cycling flow. An experimental aggregate layer that complements the spatial scores. Partial coverage, partial confidence.
Activity reading: 18 events/yr (8 recurring); 3,100 public mentions; pedestrian intensity 50/100; cycling/trail 70/100. The strongest signal is observed pedestrian/cycling activity. These are illustrative sample values. Calibrate before citing.
Sample data: numbers shown here are an illustrative fixture for the 10 named parks, not a measurement.
Does this score feel accurate?
Your read of Riverdale Park Eastmatters. We’re testing whether the model lines up with how people actually use the park. Submissions are stored locally; no account needed.
Tell us how this park feels
We measure structure (canopy, edges, connectivity). You measure feeling. Both matter, and disagreement is itself useful civic data.
What would improve this park?
Generated from the weakest measured dimensions: a starting point, not a prescription.
- Activate the edges: encourage cafés, retail or community uses on the streets that face the park; replace blank or parking-lot edges where possible.
Data sources
- City of Toronto Open Data: Parks (Green Space)Polygon boundaries, official names, types.
- Parks & Recreation FacilitiesInventory of in-park amenities (washrooms, fields, rinks…).
- Toronto Pedestrian NetworkSidewalk segments around and through parks; estimated park entrances.
- Toronto Centreline V2Street segments + intersection nodes near park edges; trails and walkways.
- Toronto 3D MassingBuilding footprints + heights for edge-building counts, frontage density, and tower-in-the-park risk.
- Toronto Treed AreaTree canopy share inside park polygons via stratified-grid sampling.
- Toronto Waterbodies & RiversWater surface inside parks + nearest-water distance for cooling.
- Ravine & Natural Feature ProtectionRavine overlap as a cooling / natural-comfort signal.
- Toronto Street Tree InventoryTree count + density inside park polygons.
- Neighbourhood Profiles(Pending) Equity context proxy.
- OpenStreetMap (Overpass API)Cafés, restaurants, retail, transit stops, parking, highways, rail.