Underpass Park
Athletic / Recreation Park, middle of the pack overall (score 39, rank ~70th percentile). Strongest: amenity diversity; weakest: natural comfort.
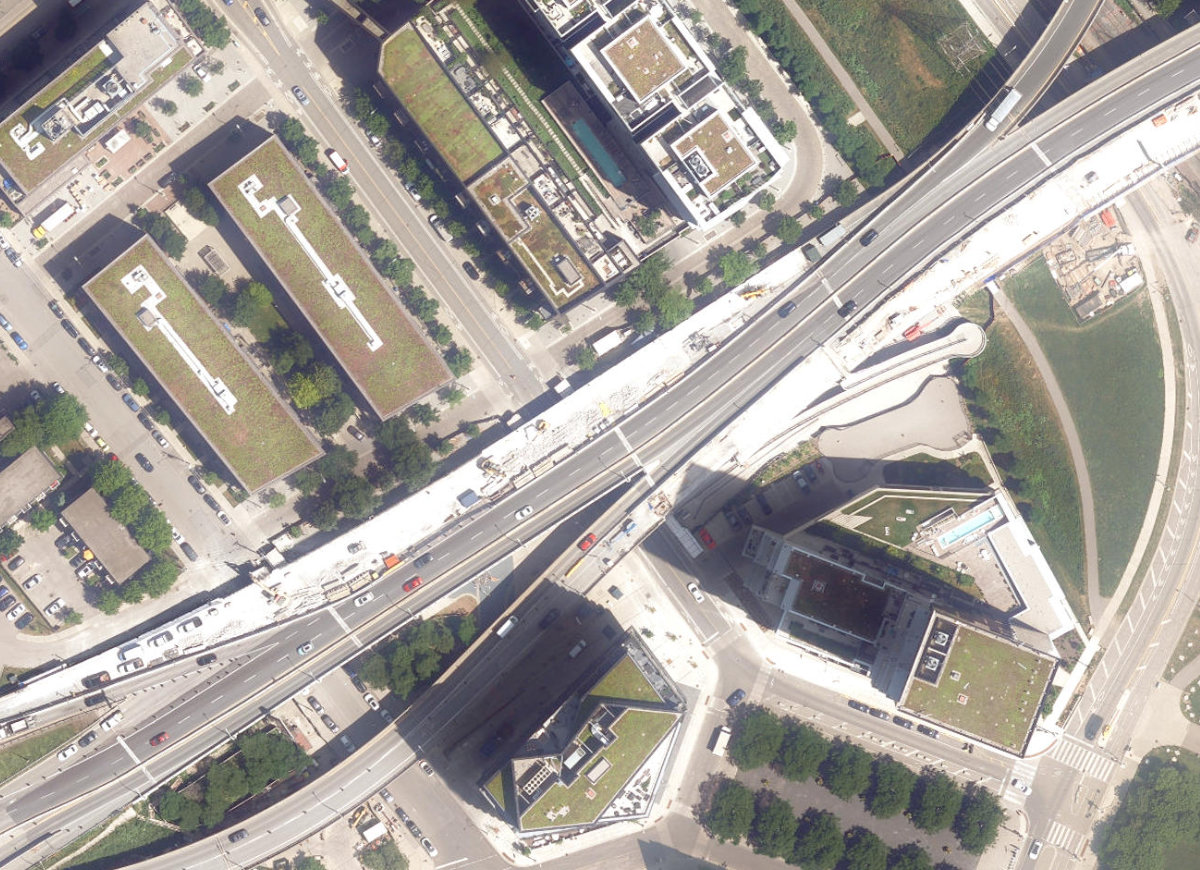
Aerial, City of Toronto orthophoto, ~8 cm/px source · cached 5/9/2026
Underpass Park scores 38.7 / 100. Strongest dimensions: connectivity and enclosure / eyes on park. Weakest: edge activation (0). Border-vacuum risk is low. This score is a transparent reading of Jane Jacobs-style vitality factors, not a definitive judgment.
Area · 0.86 ha
Weighted across six dimensions · confidence 66%
Scores are not bell-curved. Percentiles and expected scores provide context without changing the underlying model.
Loading map…
The parks map is loading.Explain this score
Where did the 39 come from? Each weighted contribution against a neutral 50 baseline. Green = pushed up; red = pulled down.
Sum of contributions = the headline score. A negative bar means that dimension dragged the park below the city-wide neutral baseline.
Why this park works
Underpass Park works because its amenity diversity score (35) is one of the city's strongest and its connectivity (71) is also top decile.
What limits this park
Underpass Park is held back by natural comfort (26, bottom quartile): only 0% canopy means little summer shade.
Most distinctive characteristic
Most distinctive feature: exceptionally high amenity diversity (35, top decile).
Jacobs reading
Underpass Park sits between an urban social park and an ecological retreat: moderately useful for both, exceptionally suited to neither.
Tradeoffs
- Connectivity (71) significantly outpaces natural comfort (26): well placed in the city but offers little shade or ecological respite.
- The park is enclosed by buildings (62) but the surrounding streets are quiet (edge activation 0): frame without animation.
- 17 nearby towers cast wind and shadow without contributing canopy: passive surveillance is plentiful but human-scale comfort is not.
Performance in context
- Citywide rank is high (70th) but typology rank is more modest (21st): the strength likely comes from the dataset average pulling lower than this typology’s baseline.
Typology classification
Classified as Athletic / Recreation Park: 50% of amenity types are athletic (basketball, skatepark)
Edge Activation
Within 100 m of the park edge: 1 active uses (restaurant) and 3 dead/hostile uses (parking_lot, rail). Active edges keep "eyes on the park" through the day; parking lots, blank institutional walls, rail and highway frontages drain street life.
Source: OSM POIs (amenity/shop) + Toronto Building Footprints + land use
Connectivity
Connectivity blends paths, intersections, transit, entrances, and edge density. This park has 4 mapped paths/walkways and 24 sidewalk segments within 50 m; 16 street intersections within 100 m; 20 transit stops within a 400 m walk; 4 estimated access points across ~617 m of perimeter. edge density is healthy, no superblock penalty. Source coverage: centreline, pedestrian_network, transit_osm.
Source: Toronto Centreline V2 + Pedestrian Network + OSM transit stops
Amenity Diversity
4 distinct amenity types in the park (basketball, picnic, playground, skatepark). Diversity, not raw count, drives the score so a park with many distinct activity types can outrank a larger park that repeats the same use.
Source: Toronto Parks & Recreation Facilities + OSM amenity tags
Natural Comfort
Natural-comfort components for this park: 0.0% estimated tree canopy; nearest waterbody ~167 m. Reading: water-cooled. Source coverage: waterbodies. Impervious surface is approximated (Toronto's authoritative layer ships only as a raster GeoTIFF).
Source: Toronto Treed Area + Ravine + Waterbodies + Street Tree Inventory
Enclosure / Eyes on Park
43 buildings within 25 m of the park edge (21 mid-rise, 5 low-rise, 17 tower); avg edge height 39.7 m (~13 floors); 7.0 buildings per 100 m of 617 m perimeter (strong frontage density); edges lean tall but still framed; 17 towers ≥ 40 m within 25 m of the edge. "Eyes on the park" come strongest from the 21 mid-rise edge buildings.
Source: Toronto 3D Massing (building footprints + heights)
Border Vacuum Risk
Border-vacuum factors within 50 m of the park: parking_lot, parking_lot. Jacobs warned that highways, rail, parking lots and blank institutional edges act as "vacuums" that suppress foot traffic and isolate the park from its neighbourhood.
Source: Toronto Street Centreline (highways) + rail layer + OSM landuse + building footprints
Equity Context
Equity Context requires inputs not yet loaded for this park (Toronto Neighbourhood Profiles). Score is held at a neutral 50 with low confidence. Read with caution.
Source: Toronto Neighbourhood Profiles
Amenities (4 types · 4 records)
- basketball
- picnic
- playground
- skatepark
Nearby active-edge features (27)
- parking lot28 m
- parking lot32 m
- restaurant: Lisbon Hotel52 m
- rail: GO Transit - Bala Subdivision82 m
- restaurant: Impact Kitchen117 m
- retail: Corktown Cleaners118 m
- retail121 m
- cafe: Tim Hortons124 m
- retail: Gears129 m
- retail: Genesis Downtown131 m
- retail: Downtown Lincoln/Downtown Ford137 m
- parking lot139 m
- transit stop: River Street140 m
- retail: Toyota Downtown144 m
- highway: Don Valley Parkway148 m
- transit stop: River Street152 m
- transit stop: King Street East158 m
- transit stop: Sumach Street162 m
- parking lot168 m
- restaurant: il ponte174 m
- highway: Don Valley Parkway179 m
- parking lot188 m
- retail188 m
- transit stop: Queen Street East192 m
- transit stop: Sumach Street194 m
- retail: Expedia Cruises195 m
- highway: Don Valley Parkway196 m
Park profile
Five-axis radar across the structural dimensions.
Citywide percentile ranks
Across all Toronto parks in the dataset.
- Overall vitality70th
- Edge activation32th
- Connectivity91th
- Amenity diversity97th
- Natural comfort11th
- Enclosure42th
Most similar parks
Closest in metric space across the five structural dimensions.
- North Bendale ParkAthletic / Recreation Park41
- Baycrest ParkCorridor / Linear Park32
- Fundy Bay ParkAthletic / Recreation Park39
- Queensway ParkCorridor / Linear Park43
- Hendon ParkAthletic / Recreation Park41
Most opposite parks
Furthest in metric space. Useful for recognising what kind of park this isn’t.
- Trca Lands ( 26)Ravine / Naturalized Park27
- Mclevin Woods ParkRavine / Naturalized Park49
- Toronto Islands - Muggs Island ParkRavine / Naturalized Park25
- Market Lane ParkUrban Plaza63
- Rouge ParkRavine / Naturalized Park28
Human activity signals
Programming, social attention, temporal rhythm, and nearby pedestrian / cycling flow. An experimental aggregate layer that complements the spatial scores. Partial coverage, partial confidence.
Activity reading: 8 events/yr (1 recurring); 1,900 public mentions; pedestrian intensity 35/100; cycling/trail 60/100. The strongest signal is observed pedestrian/cycling activity. These are illustrative sample values. Calibrate before citing.
Sample data: numbers shown here are an illustrative fixture for the 10 named parks, not a measurement.
Does this score feel accurate?
Your read of Underpass Parkmatters. We’re testing whether the model lines up with how people actually use the park. Submissions are stored locally; no account needed.
Tell us how this park feels
We measure structure (canopy, edges, connectivity). You measure feeling. Both matter, and disagreement is itself useful civic data.
What would improve this park?
Generated from the weakest measured dimensions: a starting point, not a prescription.
- Activate the edges: encourage cafés, retail or community uses on the streets that face the park; replace blank or parking-lot edges where possible.
- Diversify what people can do in the park (playground, washroom, water, shade, performance, sport, garden): even small additions raise this score.
- Increase canopy and reduce paved area. Shade and water features extend usable hours and seasons.
Data sources
- City of Toronto Open Data: Parks (Green Space)Polygon boundaries, official names, types.
- Parks & Recreation FacilitiesInventory of in-park amenities (washrooms, fields, rinks…).
- Toronto Pedestrian NetworkSidewalk segments around and through parks; estimated park entrances.
- Toronto Centreline V2Street segments + intersection nodes near park edges; trails and walkways.
- Toronto 3D MassingBuilding footprints + heights for edge-building counts, frontage density, and tower-in-the-park risk.
- Toronto Treed AreaTree canopy share inside park polygons via stratified-grid sampling.
- Toronto Waterbodies & RiversWater surface inside parks + nearest-water distance for cooling.
- Ravine & Natural Feature ProtectionRavine overlap as a cooling / natural-comfort signal.
- Toronto Street Tree InventoryTree count + density inside park polygons.
- Neighbourhood Profiles(Pending) Equity context proxy.
- OpenStreetMap (Overpass API)Cafés, restaurants, retail, transit stops, parking, highways, rail.