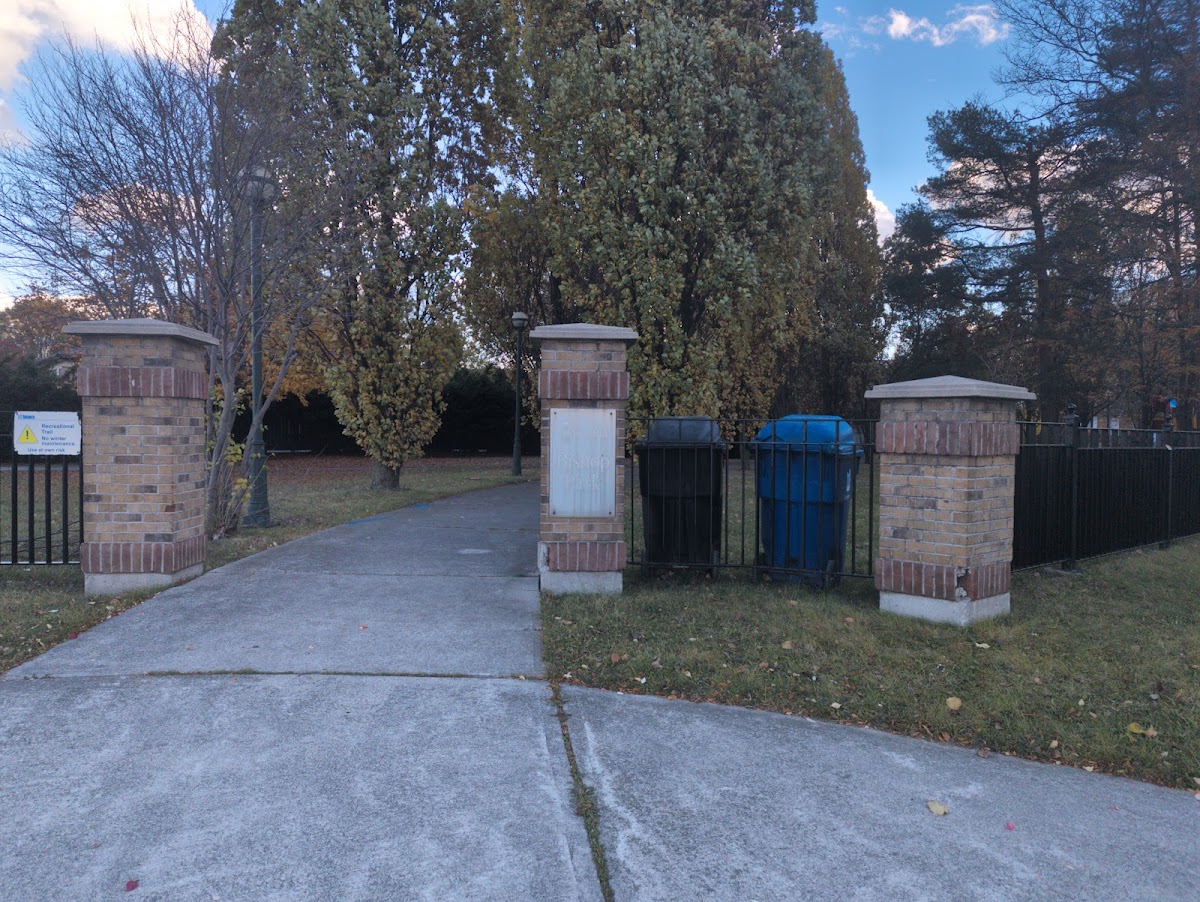
Bishop Park
Urban Plaza, in the top tier overall (score 44, rank ~87th percentile). Strongest: enclosure; weakest: edge activation.
Photo by N via Google Places · cached 5/9/2026
Bishop Park scores 43.8 / 100. Strongest dimensions: enclosure / eyes on park and connectivity. Weakest: edge activation (0). Border-vacuum risk is low. This score is a transparent reading of Jane Jacobs-style vitality factors, not a definitive judgment.
Area · 0.28 ha
Weighted across six dimensions · confidence 70%
Scores are not bell-curved. Percentiles and expected scores provide context without changing the underlying model.
Loading map…
The parks map is loading.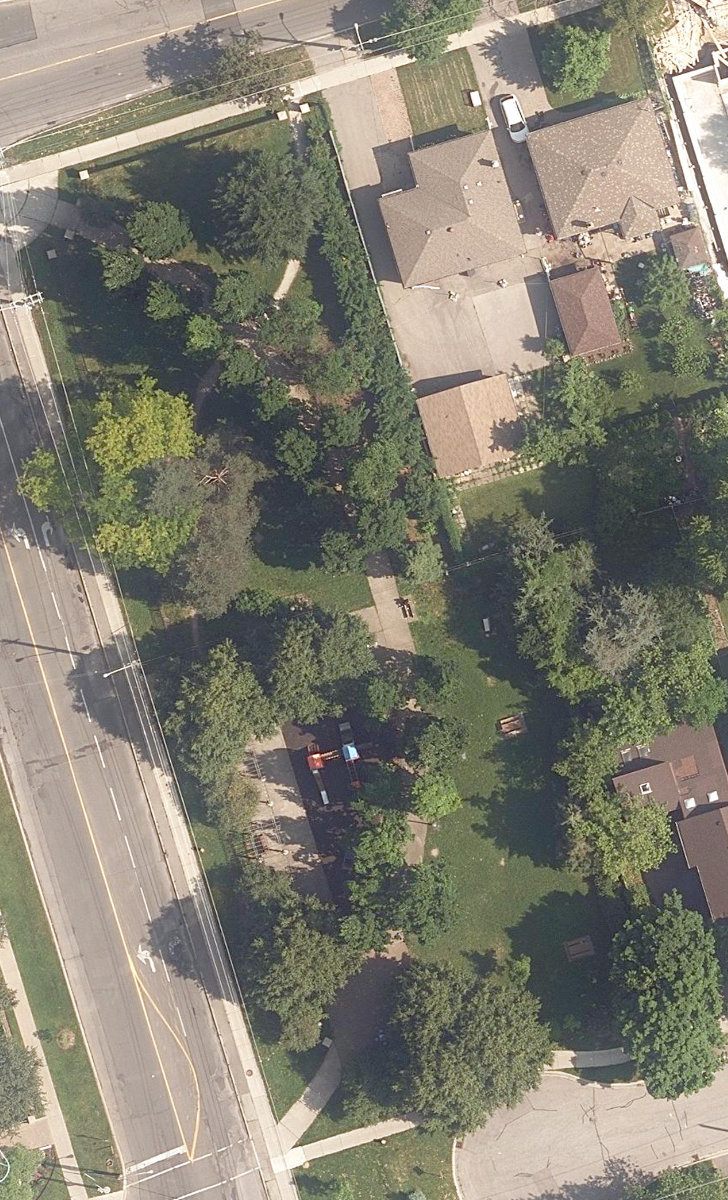
Explain this score
Where did the 44 come from? Each weighted contribution against a neutral 50 baseline. Green = pushed up; red = pulled down.
Sum of contributions = the headline score. A negative bar means that dimension dragged the park below the city-wide neutral baseline.
Why this park works
Bishop Park works because its enclosure score (89) is one of the city's strongest and its connectivity (70) is also top decile (8 mid-rise buildings frame the edge with passive surveillance).
What limits this park
Bishop Park is held back by edge activation (0, below-average): the surrounding streets carry too few active uses to spill into the park.
Most distinctive characteristic
Most distinctive feature: exceptionally high enclosure (89, top decile).
Jacobs reading
Bishop Park sits between an urban social park and an ecological retreat: moderately useful for both, exceptionally suited to neither.
Tradeoffs
- The park is enclosed by buildings (89) but the surrounding streets are quiet (edge activation 0): frame without animation.
Typology classification
Classified as Urban Plaza: 2757 m², paved (11% canopy), 16.3 buildings/100 m
Edge Activation
Within 100 m of the park edge: 0 active uses (none) and 0 dead/hostile uses (none). Active edges keep "eyes on the park" through the day; parking lots, blank institutional walls, rail and highway frontages drain street life.
Source: OSM POIs (amenity/shop) + Toronto Building Footprints + land use
Connectivity
Connectivity blends paths, intersections, transit, entrances, and edge density. This park has 13 mapped paths/walkways and 9 sidewalk segments within 50 m; 6 street intersections within 100 m; 57 transit stops within a 400 m walk; 4 estimated access points across ~246 m of perimeter. edge density is healthy, no superblock penalty. Source coverage: centreline, pedestrian_network, transit_osm.
Source: Toronto Centreline V2 + Pedestrian Network + OSM transit stops
Amenity Diversity
1 distinct amenity types in the park (playground). Diversity, not raw count, drives the score so a park with many distinct activity types can outrank a larger park that repeats the same use.
Source: Toronto Parks & Recreation Facilities + OSM amenity tags
Natural Comfort
Natural-comfort components for this park: ~18.9% effective canopy (11.1% from contiguous tree polygons + scattered tree density); nearest waterbody ~593 m; 27 city-mapped trees inside the polygon (27.0/ha). Reading: exposed. Source coverage: treed_area, waterbodies, street_trees. Impervious surface is approximated (Toronto's authoritative layer ships only as a raster GeoTIFF).
Source: Toronto Treed Area + Ravine + Waterbodies + Street Tree Inventory
Enclosure / Eyes on Park
40 buildings within 25 m of the park edge (8 mid-rise, 30 low-rise, 2 tower); avg edge height 13.3 m (~4 floors); 16.3 buildings per 100 m of 246 m perimeter (strong frontage density); edges are at a Jacobs-scale walkable mid-rise (3 to 7 floors); 2 towers ≥ 40 m within 25 m of the edge. "Eyes on the park" come strongest from the 8 mid-rise edge buildings.
Source: Toronto 3D Massing (building footprints + heights)
Border Vacuum Risk
Park edges face the city. No significant border vacuum detected.
Source: Toronto Street Centreline (highways) + rail layer + OSM landuse + building footprints
Equity Context
Equity Context requires inputs not yet loaded for this park (Toronto Neighbourhood Profiles). Score is held at a neutral 50 with low confidence. Read with caution.
Source: Toronto Neighbourhood Profiles
Amenities (1 types · 1 records)
- playground
Nearby active-edge features (22)
- transit stop: Kenneth Avenue100 m
- parking lot: Bus Parking121 m
- parking lot123 m
- transit stop: Finch GO Bus Terminal Platform 6124 m
- transit stop: Kenneth Avenue129 m
- parking lot141 m
- transit stop: Finch GO Bus Terminal Platform 5143 m
- transit stop: Pemberton Av Entrance145 m
- transit stop: Finch GO Bus Terminal Platform 16147 m
- transit stop: Finch GO Bus Terminal Platform 17152 m
- transit stop: Finch GO Bus Terminal Platform 8156 m
- parking lot160 m
- transit stop: Finch GO Bus Terminal Platform 4160 m
- parking lot162 m
- transit stop: Finch GO Bus Terminal Platform 18166 m
- transit stop: Finch GO Bus Terminal Platform 15166 m
- transit stop: Finch GO Bus Terminal Platform 9174 m
- transit stop: Finch GO Bus Terminal Platform 3179 m
- retail187 m
- transit stop: Finch GO Bus Terminal Platform 10195 m
- transit stop: Finch Station196 m
- transit stop197 m
Park profile
Five-axis radar across the structural dimensions.
Citywide percentile ranks
Across all Toronto parks in the dataset.
- Overall vitality87th
- Edge activation33th
- Connectivity91th
- Amenity diversity75th
- Natural comfort70th
- Enclosure95th
Most similar parks
Closest in metric space across the five structural dimensions.
- Michael Power ParkParkette40
- Davenport Village ParkParkette41
- Flora Voisey ParkRavine / Naturalized Park42
- Dan Iannuzzi ParkWaterfront Park39
- Sergeant Ryan Russell ParketteUrban Plaza39
Most opposite parks
Furthest in metric space. Useful for recognising what kind of park this isn’t.
- Toronto Islands - Muggs Island ParkRavine / Naturalized Park25
- Rouge ParkRavine / Naturalized Park21
- Trca Lands ( 26)Ravine / Naturalized Park27
- Rouge ParkWaterfront Park25
- Simcoe ParkTower-Community Green Space51
Visitor signals
Public attention measured by Google Places aggregates. This proxies attention, not occupancy. Aggregate-only: no usernames, no review text, no extra photos beyond the cached hero.
p63 citywide · p66 within Urban Plaza
Source: Google Places API · match high (0.97 composite confidence) · last refreshed 5/9/2026. Privacy contract. Measures public attention, not occupancy.
Human activity signals: not available
No activity signals have landed for this park yet. The model has scored its physical form but it can’t yet say how often it’s programmed, photographed, or walked through. See /data-ethics for what we will and will not collect.
Does this score feel accurate?
Your read of Bishop Parkmatters. We’re testing whether the model lines up with how people actually use the park. Submissions are stored locally; no account needed.
Tell us how this park feels
We measure structure (canopy, edges, connectivity). You measure feeling. Both matter, and disagreement is itself useful civic data.
What would improve this park?
Generated from the weakest measured dimensions: a starting point, not a prescription.
- Activate the edges: encourage cafés, retail or community uses on the streets that face the park; replace blank or parking-lot edges where possible.
- Diversify what people can do in the park (playground, washroom, water, shade, performance, sport, garden): even small additions raise this score.
Data sources
- City of Toronto Open Data: Parks (Green Space)Polygon boundaries, official names, types.
- Parks & Recreation FacilitiesInventory of in-park amenities (washrooms, fields, rinks…).
- Toronto Pedestrian NetworkSidewalk segments around and through parks; estimated park entrances.
- Toronto Centreline V2Street segments + intersection nodes near park edges; trails and walkways.
- Toronto 3D MassingBuilding footprints + heights for edge-building counts, frontage density, and tower-in-the-park risk.
- Toronto Treed AreaTree canopy share inside park polygons via stratified-grid sampling.
- Toronto Waterbodies & RiversWater surface inside parks + nearest-water distance for cooling.
- Ravine & Natural Feature ProtectionRavine overlap as a cooling / natural-comfort signal.
- Toronto Street Tree InventoryTree count + density inside park polygons.
- Neighbourhood Profiles(Pending) Equity context proxy.
- OpenStreetMap (Overpass API)Cafés, restaurants, retail, transit stops, parking, highways, rail.