Glen Stewart Park
Ravine / Naturalized Park, in the top tier overall (score 49, rank ~95th percentile). Strongest: connectivity; weakest: natural comfort.
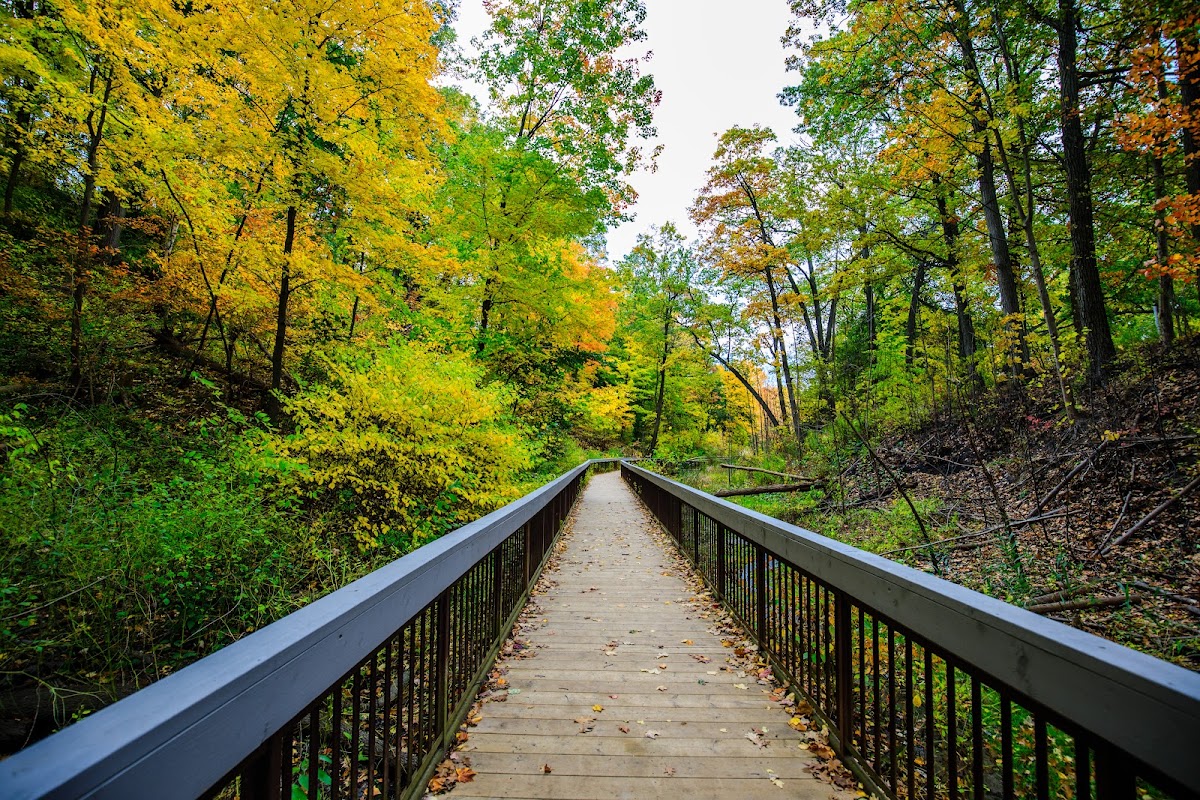
Photo by Clement Lo via Google Places · cached 5/9/2026
Glen Stewart Park scores 49.3 / 100. Strongest dimensions: connectivity and enclosure / eyes on park. Weakest: amenity diversity (11.9). Border-vacuum risk is elevated (42). This score is a transparent reading of Jane Jacobs-style vitality factors, not a definitive judgment.
Area · 7.88 ha
Weighted across six dimensions · confidence 68%
Scores are not bell-curved. Percentiles and expected scores provide context without changing the underlying model.
Loading map…
The parks map is loading.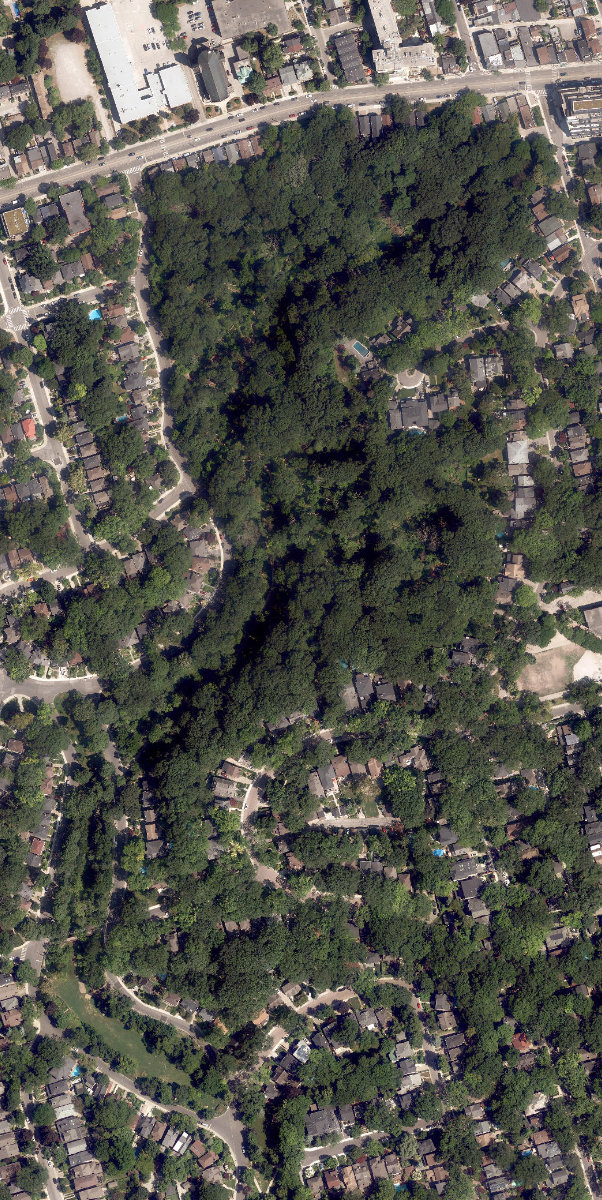
Explain this score
Where did the 49 come from? Each weighted contribution against a neutral 50 baseline. Green = pushed up; red = pulled down.
Sum of contributions = the headline score. A negative bar means that dimension dragged the park below the city-wide neutral baseline.
Why this park works
Glen Stewart Park works because its connectivity score (78) is one of the city's strongest and its edge activation (47) is also top decile (27 transit stops sit within a 400 m walk; 38 intersections fall within 100 m of the edge).
What limits this park
Glen Stewart Park's edges are fronted by border-vacuum land uses (highways, rail, parking, blank institutional), risk score 42.
Most distinctive characteristic
Most distinctive feature: exceptionally high connectivity (78, top decile).
Jacobs reading
Glen Stewart Park sits between an urban social park and an ecological retreat: moderately useful for both, exceptionally suited to neither.
Tradeoffs
- Connectivity (78) significantly outpaces natural comfort (42): well placed in the city but offers little shade or ecological respite.
Performance in context
- This park is a strong overperformer for its cohort: raw 49 versus an expected 36 for similar parks (large Ravine / Naturalized Park ravine) (gap +13).
Typology classification
Classified as Ravine / Naturalized Park: 97% ravine overlap, 0% canopy. Secondary read: Corridor / Linear Park (shape elongation 2.7× a circle of equal area).
Edge Activation
Within 100 m of the park edge: 15 active uses (transit_stop, community, retail, cafe) and 3 dead/hostile uses (highway, parking_lot). Active edges keep "eyes on the park" through the day; parking lots, blank institutional walls, rail and highway frontages drain street life.
Source: OSM POIs (amenity/shop) + Toronto Building Footprints + land use
Connectivity
Connectivity blends paths, intersections, transit, entrances, and edge density. This park has 9 mapped paths/walkways and 60 sidewalk segments within 50 m; 38 street intersections within 100 m; 27 transit stops within a 400 m walk; 9 estimated access points across ~2,684 m of perimeter. edge density is healthy, no superblock penalty. Source coverage: centreline, pedestrian_network, transit_osm.
Source: Toronto Centreline V2 + Pedestrian Network + OSM transit stops
Amenity Diversity
1 distinct amenity types in the park (picnic). Diversity, not raw count, drives the score so a park with many distinct activity types can outrank a larger park that repeats the same use.
Source: Toronto Parks & Recreation Facilities + OSM amenity tags
Natural Comfort
Natural-comfort components for this park: 0.0% estimated tree canopy; 97.3% inside the ravine system; 2.7% water surface; 7 city-mapped trees inside the polygon (0.9/ha). Reading: ravine-cooled. Source coverage: ravine, waterbodies, street_trees. Impervious surface is approximated (Toronto's authoritative layer ships only as a raster GeoTIFF).
Source: Toronto Treed Area + Ravine + Waterbodies + Street Tree Inventory
Enclosure / Eyes on Park
383 buildings within 25 m of the park edge (34 mid-rise, 349 low-rise, 0 tower); avg edge height 6.5 m (~2 floors); 14.3 buildings per 100 m of 2,684 m perimeter (strong frontage density); edges are low-rise (mostly 2 to 3 floors); no towers immediately adjacent. "Eyes on the park" come strongest from the 34 mid-rise edge buildings.
Source: Toronto 3D Massing (building footprints + heights)
Border Vacuum Risk
Border-vacuum factors within 50 m of the park: parking_lot, Kingston Road. Jacobs warned that highways, rail, parking lots and blank institutional edges act as "vacuums" that suppress foot traffic and isolate the park from its neighbourhood.
Source: Toronto Street Centreline (highways) + rail layer + OSM landuse + building footprints
Equity Context
Equity Context requires inputs not yet loaded for this park (Toronto Neighbourhood Profiles). Score is held at a neutral 50 with low confidence. Read with caution.
Source: Toronto Neighbourhood Profiles
Amenities (1 types · 1 records)
- picnic
Nearby active-edge features (42)
- highway: Kingston Road22 m
- retail: Youliton Best Convenience33 m
- transit stop: Glen Manor Drive44 m
- parking lot45 m
- transit stop: Beech Avenue45 m
- transit stop: Glen Manor Drive50 m
- transit stop: Beech Avenue54 m
- retail: Ava's Appletree54 m
- retail: Cobalt Gallery58 m
- retail: Eaune58 m
- cafe: Black Dog Cafe59 m
- retail: Skaut59 m
- community: Balmy Beach Community Recreation Centre66 m
- retail: Fearless Meat72 m
- retail: Alma Florists77 m
- highway: Kingston Road80 m
- transit stop: Southwood Drive82 m
- retail: Sun's Milk97 m
- retail: Beach Sound Records101 m
- transit stop: Williamson Road103 m
- retail: Lewis' Auto Service103 m
- retail: The Black Canary104 m
- highway: Kingston Road105 m
- restaurant: Kibo Sushi House116 m
- retail: Krypto Nails129 m
- transit stop: Glen Ames129 m
- retail: Naturally Yours142 m
- transit stop: Glen Ames145 m
- transit stop: Williamson Road146 m
- highway: Kingston Road149 m
- retail: Trinity Gallery155 m
- retail: Naturally Yours Health Foods156 m
- highway: Kingston Road162 m
- restaurant: 99 Bottles166 m
- parking lot170 m
- parking lot175 m
- retail: Blossom & Tempest175 m
- retail: The Pegasus Shoppe181 m
- retail: Sarah's Dry Cleaners183 m
- retail: Ciao Bella185 m
- parking lot: Queen/Hammersmith187 m
- retail: Silver Birch Laundry Toronto191 m
Park profile
Five-axis radar across the structural dimensions.
Citywide percentile ranks
Across all Toronto parks in the dataset.
- Overall vitality95th
- Edge activation95th
- Connectivity97th
- Amenity diversity84th
- Natural comfort42th
- Enclosure74th
Most similar parks
Closest in metric space across the five structural dimensions.
- Liberty Village ParkCivic Square55
- Susan Tibaldi ParketteUrban Plaza48
- S.A.D.R.A. ParkCorridor / Linear Park52
- Wenderly ParkNeighbourhood Park52
- Art Eggleton ParkUrban Plaza56
Most opposite parks
Furthest in metric space. Useful for recognising what kind of park this isn’t.
- Trca Lands ( 26)Ravine / Naturalized Park27
- Toronto Islands - Muggs Island ParkRavine / Naturalized Park25
- Rouge ParkRavine / Naturalized Park26
- Rouge ParkRavine / Naturalized Park28
- Rouge ParkWaterfront Park25
Visitor signals
Public attention measured by Google Places aggregates. This proxies attention, not occupancy. Aggregate-only: no usernames, no review text, no extra photos beyond the cached hero.
“Outdoor preserve featuring a shaded, boardwalk trail winding through a gorge & stream.” (Google editorial summary)
p91 citywide · p92 within Ravine / Naturalized Park
Source: Google Places API · match high (0.96 composite confidence) · last refreshed 5/9/2026. Privacy contract. Measures public attention, not occupancy.
Human activity signals: not available
No activity signals have landed for this park yet. The model has scored its physical form but it can’t yet say how often it’s programmed, photographed, or walked through. See /data-ethics for what we will and will not collect.
Does this score feel accurate?
Your read of Glen Stewart Parkmatters. We’re testing whether the model lines up with how people actually use the park. Submissions are stored locally; no account needed.
Tell us how this park feels
We measure structure (canopy, edges, connectivity). You measure feeling. Both matter, and disagreement is itself useful civic data.
What would improve this park?
Generated from the weakest measured dimensions: a starting point, not a prescription.
- Activate the edges: encourage cafés, retail or community uses on the streets that face the park; replace blank or parking-lot edges where possible.
- Diversify what people can do in the park (playground, washroom, water, shade, performance, sport, garden): even small additions raise this score.
- Increase canopy and reduce paved area. Shade and water features extend usable hours and seasons.
- Mitigate border vacuums (highways, rail, parking) with active programming on the still-permeable edges and treat the hostile edge as a design challenge.
Data sources
- City of Toronto Open Data: Parks (Green Space)Polygon boundaries, official names, types.
- Parks & Recreation FacilitiesInventory of in-park amenities (washrooms, fields, rinks…).
- Toronto Pedestrian NetworkSidewalk segments around and through parks; estimated park entrances.
- Toronto Centreline V2Street segments + intersection nodes near park edges; trails and walkways.
- Toronto 3D MassingBuilding footprints + heights for edge-building counts, frontage density, and tower-in-the-park risk.
- Toronto Treed AreaTree canopy share inside park polygons via stratified-grid sampling.
- Toronto Waterbodies & RiversWater surface inside parks + nearest-water distance for cooling.
- Ravine & Natural Feature ProtectionRavine overlap as a cooling / natural-comfort signal.
- Toronto Street Tree InventoryTree count + density inside park polygons.
- Neighbourhood Profiles(Pending) Equity context proxy.
- OpenStreetMap (Overpass API)Cafés, restaurants, retail, transit stops, parking, highways, rail.