Osler Playground
Parkette, in the top tier overall (score 49, rank ~94th percentile). Strongest: connectivity; weakest: natural comfort.
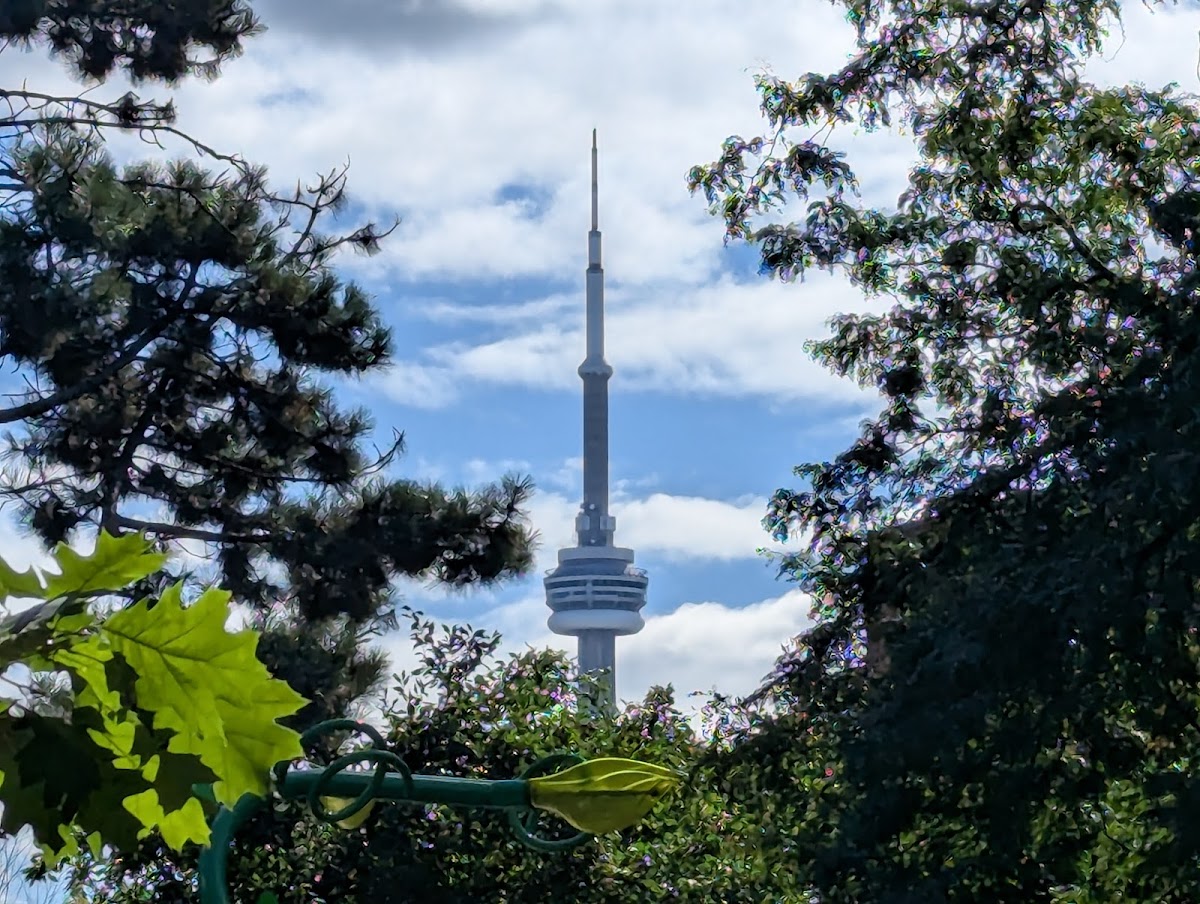
Photo by Mike Geguzis via Google Places · cached 5/9/2026
Osler Playground scores 48.6 / 100. Strongest dimensions: enclosure / eyes on park and connectivity. Weakest: amenity diversity (21). Border-vacuum risk is low. This score is a transparent reading of Jane Jacobs-style vitality factors, not a definitive judgment.
Area · 0.60 ha
Weighted across six dimensions · confidence 66%
Scores are not bell-curved. Percentiles and expected scores provide context without changing the underlying model.
Loading map…
The parks map is loading.
Explain this score
Where did the 49 come from? Each weighted contribution against a neutral 50 baseline. Green = pushed up; red = pulled down.
Sum of contributions = the headline score. A negative bar means that dimension dragged the park below the city-wide neutral baseline.
Why this park works
Osler Playground works because its connectivity score (72) is in the top tier and its amenity diversity (21) is also top decile (15 transit stops sit within a 400 m walk; 16 intersections fall within 100 m of the edge).
What limits this park
Osler Playground is held back by natural comfort (38, below-average): only 0% canopy means little summer shade.
Most distinctive characteristic
Most distinctive feature: exceptionally high connectivity (72, top decile).
Jacobs reading
Osler Playground sits between an urban social park and an ecological retreat: moderately useful for both, exceptionally suited to neither.
Tradeoffs
- Connectivity (72) significantly outpaces natural comfort (38): well placed in the city but offers little shade or ecological respite.
Performance in context
- This park is a strong overperformer for its cohort: raw 49 versus an expected 36 for similar parks (small Parkette) (gap +13).
Typology classification
Classified as Parkette: small (6041 m²) with strong building frontage (25.1 per 100 m)
Edge Activation
Within 100 m of the park edge: 3 active uses (restaurant, cafe, retail) and 1 dead/hostile uses (parking_lot). Active edges keep "eyes on the park" through the day; parking lots, blank institutional walls, rail and highway frontages drain street life.
Source: OSM POIs (amenity/shop) + Toronto Building Footprints + land use
Connectivity
Connectivity blends paths, intersections, transit, entrances, and edge density. This park has 2 mapped paths/walkways and 24 sidewalk segments within 50 m; 16 street intersections within 100 m; 15 transit stops within a 400 m walk; 5 estimated access points across ~371 m of perimeter. edge density is healthy, no superblock penalty. Source coverage: centreline, pedestrian_network, transit_osm.
Source: Toronto Centreline V2 + Pedestrian Network + OSM transit stops
Amenity Diversity
2 distinct amenity types in the park (dog_area, playground). Diversity, not raw count, drives the score so a park with many distinct activity types can outrank a larger park that repeats the same use.
Source: Toronto Parks & Recreation Facilities + OSM amenity tags
Natural Comfort
Natural-comfort components for this park: ~6.3% effective canopy (0.0% from contiguous tree polygons + scattered tree density); 9 city-mapped trees inside the polygon (9.0/ha). Reading: exposed. Source coverage: street_trees. Impervious surface is approximated (Toronto's authoritative layer ships only as a raster GeoTIFF).
Source: Toronto Treed Area + Ravine + Waterbodies + Street Tree Inventory
Enclosure / Eyes on Park
93 buildings within 25 m of the park edge (8 mid-rise, 85 low-rise, 0 tower); avg edge height 7.1 m (~2 floors); 25.1 buildings per 100 m of 371 m perimeter (strong frontage density); edges are low-rise (mostly 2 to 3 floors); no towers immediately adjacent. "Eyes on the park" come strongest from the 8 mid-rise edge buildings.
Source: Toronto 3D Massing (building footprints + heights)
Border Vacuum Risk
Park edges face the city. No significant border vacuum detected.
Source: Toronto Street Centreline (highways) + rail layer + OSM landuse + building footprints
Equity Context
Equity Context requires inputs not yet loaded for this park (Toronto Neighbourhood Profiles). Score is held at a neutral 50 with low confidence. Read with caution.
Source: Toronto Neighbourhood Profiles
Amenities (2 types · 2 records)
- dog area
- playground
Nearby active-edge features (54)
- restaurant: Pizzeria Badiali28 m
- retail: J. & R. Coin Laundry30 m
- cafe: Yo Adrian40 m
- parking lot65 m
- retail: Nobrega's Variety and Grocery108 m
- restaurant: Julie's Restaurant & Bar133 m
- retail: Bellwoods Brewery Bottle Shop139 m
- retail: Venezia Bakery142 m
- restaurant: Baby Huey142 m
- retail: Mars142 m
- restaurant: Indian Grill143 m
- retail: Anice143 m
- retail: Bellwoods Tattoo143 m
- retail: VdeV144 m
- retail: Burton144 m
- restaurant: Soos146 m
- restaurant: La Cubana147 m
- restaurant: Oddseoul148 m
- retail: Cote de Boeuf149 m
- transit stop: Argyle Street149 m
- restaurant: OMAW150 m
- retail: Town Moto150 m
- restaurant: Mamakas153 m
- restaurant: Reposado153 m
- retail: Style Garage156 m
- restaurant: Tanto159 m
- restaurant: Union160 m
- transit stop: Argyle Street160 m
- restaurant: Te163 m
- restaurant: PapI Chulo's165 m
- retail: Buffer Nails & Waxing165 m
- retail: Sundays166 m
- restaurant: Golden Turtle166 m
- retail: The Latest Scoop166 m
- cafe: Pilot Coffee Roasters166 m
- retail: Fresh City Farms166 m
- retail168 m
- retail: Victoire168 m
- restaurant: Böhmer168 m
- retail: Peace Collective169 m
- retail: Mejuri169 m
- retail: Rooms Coffee170 m
- retail: Crafted171 m
- retail: Crywolf172 m
- retail: Barber & Co173 m
- restaurant: Saigon Snacks176 m
- restaurant: Bobbie Sue's Mac and Cheese178 m
- cafe: Sam James178 m
- retail: Tiger of Sweden181 m
- retail: Mario's Garage185 m
- parking lot190 m
- retail: I Miss You190 m
- restaurant: The Shozan Room192 m
- restaurant: The Ossington200 m
Park profile
Five-axis radar across the structural dimensions.
Citywide percentile ranks
Across all Toronto parks in the dataset.
- Overall vitality94th
- Edge activation86th
- Connectivity93th
- Amenity diversity92th
- Natural comfort33th
- Enclosure83th
Most similar parks
Closest in metric space across the five structural dimensions.
- SCADDING COURT COMMUNITY CENTRE - Building GroundsParkette37
- Joel Weeks ParkParkette48
- Rita Cox ParkUrban Plaza45
- Coleman ParkUrban Plaza48
- Stanley G. Grizzle ParkUrban Plaza46
Most opposite parks
Furthest in metric space. Useful for recognising what kind of park this isn’t.
- Trca Lands ( 26)Ravine / Naturalized Park27
- Toronto Islands - Muggs Island ParkRavine / Naturalized Park25
- Rouge ParkRavine / Naturalized Park28
- Rouge ParkRavine / Naturalized Park26
- Rouge ParkWaterfront Park25
Visitor signals
Public attention measured by Google Places aggregates. This proxies attention, not occupancy. Aggregate-only: no usernames, no review text, no extra photos beyond the cached hero.
“Small fenced suburban park with a kids' playground & wading pool plus grassy & tree-shaded areas.” (Google editorial summary)
p66 citywide · p67 within Parkette
Source: Google Places API · match high (0.99 composite confidence) · last refreshed 5/9/2026. Privacy contract. Measures public attention, not occupancy.
Human activity signals: not available
No activity signals have landed for this park yet. The model has scored its physical form but it can’t yet say how often it’s programmed, photographed, or walked through. See /data-ethics for what we will and will not collect.
Does this score feel accurate?
Your read of Osler Playgroundmatters. We’re testing whether the model lines up with how people actually use the park. Submissions are stored locally; no account needed.
Tell us how this park feels
We measure structure (canopy, edges, connectivity). You measure feeling. Both matter, and disagreement is itself useful civic data.
What would improve this park?
Generated from the weakest measured dimensions: a starting point, not a prescription.
- Activate the edges: encourage cafés, retail or community uses on the streets that face the park; replace blank or parking-lot edges where possible.
- Diversify what people can do in the park (playground, washroom, water, shade, performance, sport, garden): even small additions raise this score.
- Increase canopy and reduce paved area. Shade and water features extend usable hours and seasons.
Data sources
- City of Toronto Open Data: Parks (Green Space)Polygon boundaries, official names, types.
- Parks & Recreation FacilitiesInventory of in-park amenities (washrooms, fields, rinks…).
- Toronto Pedestrian NetworkSidewalk segments around and through parks; estimated park entrances.
- Toronto Centreline V2Street segments + intersection nodes near park edges; trails and walkways.
- Toronto 3D MassingBuilding footprints + heights for edge-building counts, frontage density, and tower-in-the-park risk.
- Toronto Treed AreaTree canopy share inside park polygons via stratified-grid sampling.
- Toronto Waterbodies & RiversWater surface inside parks + nearest-water distance for cooling.
- Ravine & Natural Feature ProtectionRavine overlap as a cooling / natural-comfort signal.
- Toronto Street Tree InventoryTree count + density inside park polygons.
- Neighbourhood Profiles(Pending) Equity context proxy.
- OpenStreetMap (Overpass API)Cafés, restaurants, retail, transit stops, parking, highways, rail.