Black Creek Site West
Ravine / Naturalized Park, in the top tier overall (score 45, rank ~89th percentile). Strongest: connectivity; weakest: natural comfort.
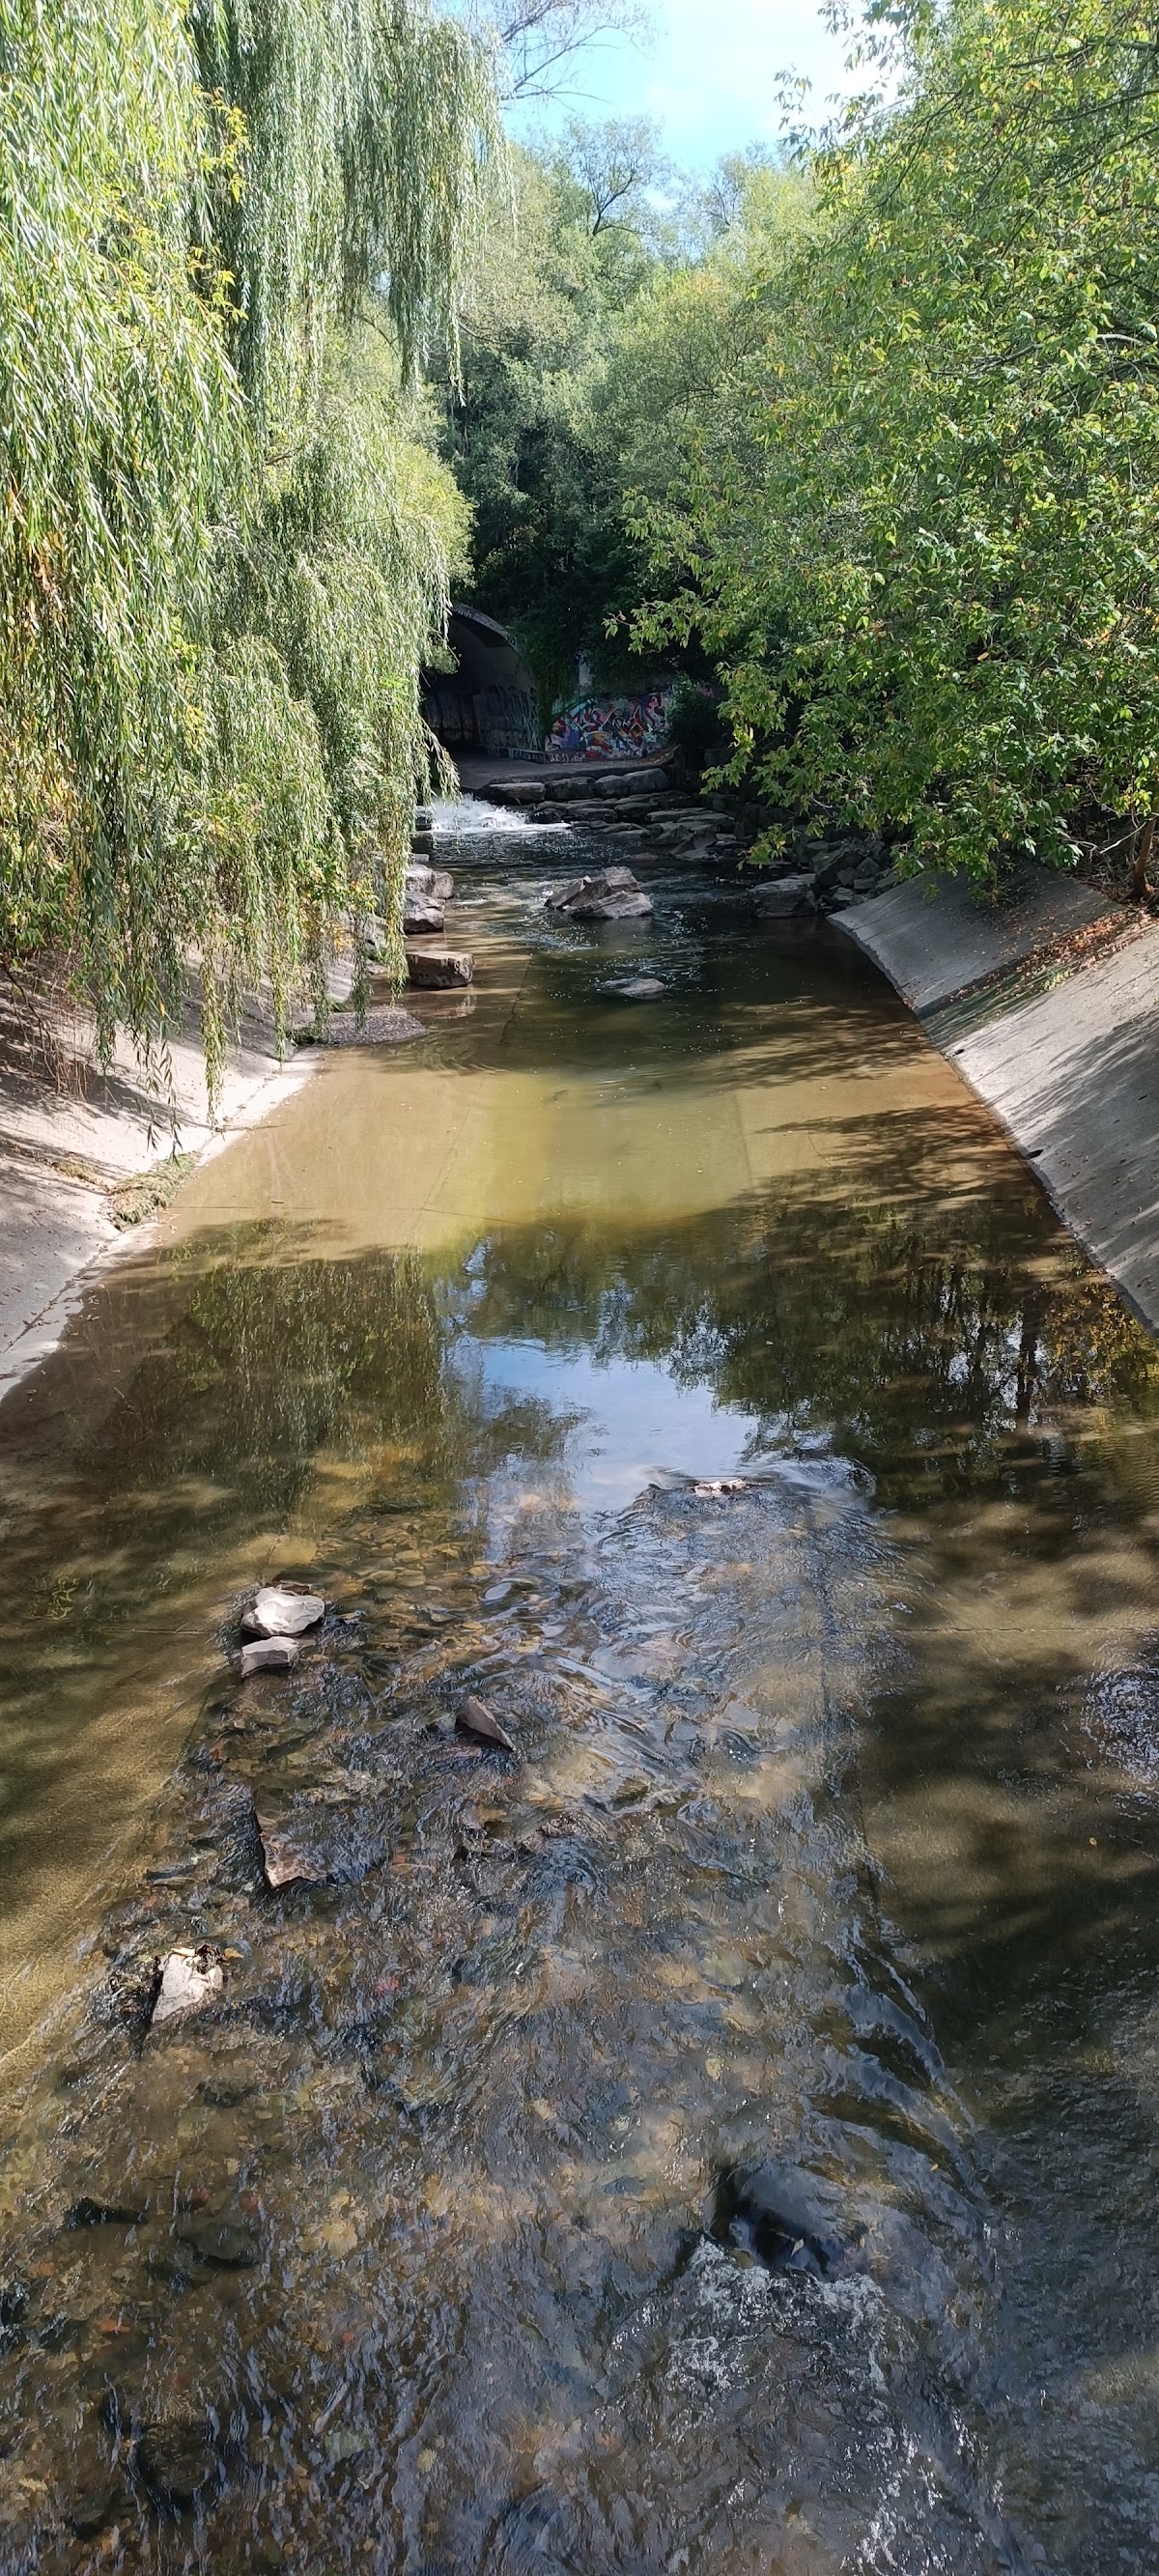
Photo by farhad zarabi nia via Google Places · cached 5/9/2026
Black Creek Site West scores 45.3 / 100. Strongest dimensions: connectivity and enclosure / eyes on park. Weakest: amenity diversity (0). Border-vacuum risk is low. This score is a transparent reading of Jane Jacobs-style vitality factors, not a definitive judgment.
Area · 8.92 ha
Weighted across six dimensions · confidence 63%
Scores are not bell-curved. Percentiles and expected scores provide context without changing the underlying model.
Loading map…
The parks map is loading.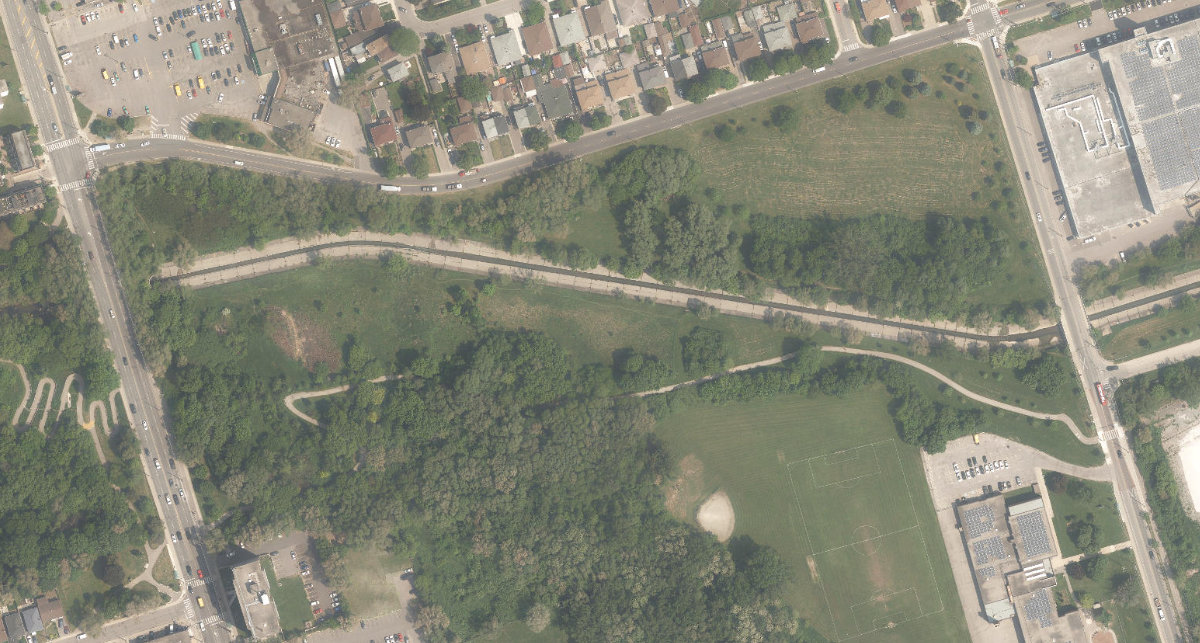
Explain this score
Where did the 45 come from? Each weighted contribution against a neutral 50 baseline. Green = pushed up; red = pulled down.
Sum of contributions = the headline score. A negative bar means that dimension dragged the park below the city-wide neutral baseline.
Why this park works
Black Creek Site West works because its connectivity score (72) is in the top tier and its edge activation (35) is also top quartile (25 transit stops sit within a 400 m walk; 14 intersections fall within 100 m of the edge).
What limits this park
.
Most distinctive characteristic
Most distinctive feature: exceptionally high connectivity (72, top decile).
Jacobs reading
Black Creek Site West sits between an urban social park and an ecological retreat: moderately useful for both, exceptionally suited to neither.
Performance in context
- A modest overperformer for its ravine / naturalized park typology (+9 vs the median in large Ravine / Naturalized Park ravine).
Typology classification
Classified as Ravine / Naturalized Park: 92% ravine overlap, 6% canopy. Secondary read: Neighbourhood Park (8.9 ha, framed by 14 mid-rise vs 1 towers).
Edge Activation
Within 100 m of the park edge: 18 active uses (retail, transit_stop, restaurant) and 5 dead/hostile uses (parking_lot). Active edges keep "eyes on the park" through the day; parking lots, blank institutional walls, rail and highway frontages drain street life.
Source: OSM POIs (amenity/shop) + Toronto Building Footprints + land use
Connectivity
Connectivity blends paths, intersections, transit, entrances, and edge density. This park has 11 mapped paths/walkways and 49 sidewalk segments within 50 m; 14 street intersections within 100 m; 25 transit stops within a 400 m walk; 3 estimated access points across ~1,666 m of perimeter. edge density is healthy, no superblock penalty. Source coverage: centreline, pedestrian_network, transit_osm.
Source: Toronto Centreline V2 + Pedestrian Network + OSM transit stops
Amenity Diversity
No amenities recorded. Score is 0 until inventory is loaded.
Source: Toronto Parks & Recreation Facilities + OSM amenity tags
Natural Comfort
Natural-comfort components for this park: ~7.5% effective canopy (6.0% from contiguous tree polygons + scattered tree density); 92.1% inside the ravine system; 1.4% water surface; 96 city-mapped trees inside the polygon (10.8/ha). Reading: ravine-cooled. Source coverage: treed_area, ravine, waterbodies, street_trees. Impervious surface is approximated (Toronto's authoritative layer ships only as a raster GeoTIFF).
Source: Toronto Treed Area + Ravine + Waterbodies + Street Tree Inventory
Enclosure / Eyes on Park
66 buildings within 25 m of the park edge (14 mid-rise, 51 low-rise, 1 tower); avg edge height 8.3 m (~3 floors); 4.0 buildings per 100 m of 1,666 m perimeter (strong frontage density); edges are low-rise (mostly 2 to 3 floors); 1 tower ≥ 40 m within 25 m of the edge. "Eyes on the park" come strongest from the 14 mid-rise edge buildings.
Source: Toronto 3D Massing (building footprints + heights)
Border Vacuum Risk
Border-vacuum factors within 50 m of the park: parking_lot, parking_lot. Jacobs warned that highways, rail, parking lots and blank institutional edges act as "vacuums" that suppress foot traffic and isolate the park from its neighbourhood.
Source: Toronto Street Centreline (highways) + rail layer + OSM landuse + building footprints
Equity Context
Equity Context requires inputs not yet loaded for this park (Toronto Neighbourhood Profiles). Score is held at a neutral 50 with low confidence. Read with caution.
Source: Toronto Neighbourhood Profiles
Amenities (0)
No amenities recorded for this park.
Nearby active-edge features (49)
- transit stop: Opposite 400 Rockcliffe Boulevard - Rockcliffe Middle School15 m
- transit stop: Alliance Avenue16 m
- parking lot19 m
- transit stop21 m
- transit stop: Haney Avenue23 m
- transit stop: Jane Street23 m
- parking lot26 m
- transit stop: 400 Rockcliffe Boulevard - Rockcliffe Middle School31 m
- transit stop: Alliance Avenue33 m
- restaurant: Church's Chicken41 m
- transit stop: Haney Avenue42 m
- transit stop: Alliance Ave at Rockcliffe Blvd50 m
- retail: Habesha Variety52 m
- restaurant: Pizza Pizza55 m
- parking lot55 m
- transit stop: Alliance Avenue59 m
- transit stop: Jane St at Alliance Ave59 m
- transit stop: Rockcliffe Boulevard61 m
- retail: ABC Dollar62 m
- parking lot71 m
- parking lot75 m
- retail: Food Basics86 m
- retail: Kenneth's Variety98 m
- restaurant: Royal Noodle Restaurant102 m
- retail: The Great Apparel Co.102 m
- retail: Value Mobile103 m
- restaurant: Mr. Sub105 m
- retail: Jane Park Super Coin Laundry106 m
- retail: Nail Gallery107 m
- retail: Best Beauty Supply109 m
- retail: Aroma Massage110 m
- retail: Hear Max Hearing Clinic110 m
- retail: Best Travel & Tours112 m
- retail: Psychic & Fortune Teller112 m
- parking lot113 m
- retail: Money Stop127 m
- retail: Mulu Home Accessory Shop129 m
- retail: Men’s Cut ‘N’ Style Barber Shop131 m
- retail: Shisha Zone132 m
- parking lot136 m
- retail: David’s Barber Shop151 m
- restaurant: 33 Beefsteak Tantuni Grill Lounge152 m
- retail: Gill’s Convenience Store168 m
- parking lot171 m
- parking lot171 m
- parking lot174 m
- restaurant: Island Breeze Restaurant176 m
- parking lot176 m
- restaurant: Subway183 m
Park profile
Five-axis radar across the structural dimensions.
Citywide percentile ranks
Across all Toronto parks in the dataset.
- Overall vitality89th
- Edge activation90th
- Connectivity93th
- Amenity diversity69th
- Natural comfort63th
- Enclosure66th
Most similar parks
Closest in metric space across the five structural dimensions.
- Ontario Hydro LandsRavine / Naturalized Park44
- Rippleton ParkCorridor / Linear Park46
- Kiwanis ParketteRavine / Naturalized Park49
- West Highland Creek WatercourseWaterfront Park45
- Bill Hancox ParkNeighbourhood Park48
Most opposite parks
Furthest in metric space. Useful for recognising what kind of park this isn’t.
- Trca Lands ( 26)Ravine / Naturalized Park27
- Toronto Islands - Muggs Island ParkRavine / Naturalized Park25
- Rouge ParkRavine / Naturalized Park26
- Rouge ParkRavine / Naturalized Park21
- Rouge ParkRavine / Naturalized Park28
Visitor signals
Public attention measured by Google Places aggregates. This proxies attention, not occupancy. Aggregate-only: no usernames, no review text, no extra photos beyond the cached hero.
p9 citywide · p11 within Ravine / Naturalized Park
- match flagged for human review, confidence dampened
Source: Google Places API · match needs_review (0.46 composite confidence) · last refreshed 5/9/2026. Privacy contract. Measures public attention, not occupancy.
Human activity signals: not available
No activity signals have landed for this park yet. The model has scored its physical form but it can’t yet say how often it’s programmed, photographed, or walked through. See /data-ethics for what we will and will not collect.
Does this score feel accurate?
Your read of Black Creek Site Westmatters. We’re testing whether the model lines up with how people actually use the park. Submissions are stored locally; no account needed.
Tell us how this park feels
We measure structure (canopy, edges, connectivity). You measure feeling. Both matter, and disagreement is itself useful civic data.
What would improve this park?
Generated from the weakest measured dimensions: a starting point, not a prescription.
- Activate the edges: encourage cafés, retail or community uses on the streets that face the park; replace blank or parking-lot edges where possible.
- Diversify what people can do in the park (playground, washroom, water, shade, performance, sport, garden): even small additions raise this score.
Data sources
- City of Toronto Open Data: Parks (Green Space)Polygon boundaries, official names, types.
- Parks & Recreation FacilitiesInventory of in-park amenities (washrooms, fields, rinks…).
- Toronto Pedestrian NetworkSidewalk segments around and through parks; estimated park entrances.
- Toronto Centreline V2Street segments + intersection nodes near park edges; trails and walkways.
- Toronto 3D MassingBuilding footprints + heights for edge-building counts, frontage density, and tower-in-the-park risk.
- Toronto Treed AreaTree canopy share inside park polygons via stratified-grid sampling.
- Toronto Waterbodies & RiversWater surface inside parks + nearest-water distance for cooling.
- Ravine & Natural Feature ProtectionRavine overlap as a cooling / natural-comfort signal.
- Toronto Street Tree InventoryTree count + density inside park polygons.
- Neighbourhood Profiles(Pending) Equity context proxy.
- OpenStreetMap (Overpass API)Cafés, restaurants, retail, transit stops, parking, highways, rail.